In my hometown of Newport Beach, there is a surf spot called “The Wedge” that is known to generate some of the biggest waves in the area. When the surf is running high, this spot can produce amazing moments of skilled conquest and scary flashes of near death defeat.
Here is a quick video if you don’t believe me.
Such is the nature of the market at this juncture as stocks attempt to regain a definable trend. After the carnage of the August sell-off, the SPDR S&P 500 ETF (SPY) has produced euphoric rallies and concomitant swift drops. As a result of this tug-of-war between the bulls and bears, the most obvious pattern that is developing is a large and definable SPY wedge pattern.
S&P 500 ETF – SPY Wedge Pattern
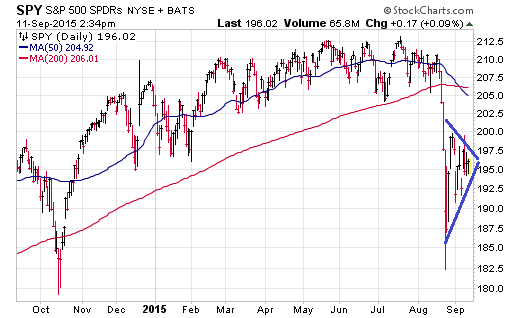
How the SPY wedge pattern formed and where the market stands right now:
From the July high to the August intra-day low, SPY dropped 14%. It has since recovered roughly half of that decline. As a result of this latest around of volatility, we are also starting to see the 50 and 200-day moving averages begin to rollover and trend lower.
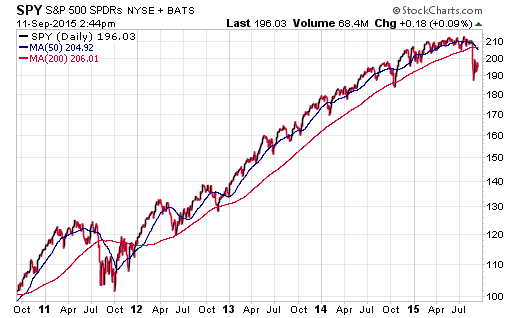
This technical pattern is something that the major stock market indices haven’t had to contend with since a similar event unfolded in August 2011. Of course, we now know that was a historical period of short-term market volatility that was then followed by multiple years of double digit gains for stocks. Much to the chagrin of the bears.
S&P 500 ETF – SPY 5 Year Chart
Probably the most disconcerting factor that individual investors are being challenged with is how quickly the markets are moving. We had become complacent with an extended period of low volatility that was disrupted in a matter of days rather than weeks or months.
Now indexes such as S&P 500 are trying to reclaim a sense of stability and everyone is nervous about how this SPY wedge pattern will ultimately resolve itself. This is especially true when put in the context of the big overnight gaps alongside very erratic daily price action. It’s simply a tough tape to call either way.
My recommendation at this juncture is to evaluate how your portfolio has held up during this sell off. If you are an active investor or trader that was leaning too hard on the risk side, you may have found yourself stopped out of a few positions or underwater in new holdings. Make sure that you are comfortable with a potential re-test of the August lows as a zone of support. Another similarly likely proposition is that the market shakes off this transient volatility and heads higher.
For those that have been underinvested or waiting for a pullback, this volatility should be looked at as an opportunity. Everyone is dying for a 10% dip to buy during a bull market. Yet when that event occurs, few have a ready-made watch list or game plan for putting money to work. Often times they let fear dictate their decisions rather than making sound portfolio management choices.
You certainly don’t have to go “all in” on stocks right here, but you can begin to work through a strategy for averaging into new holdings or setting definable triggers for taking action. In my opinion, having a clear investment plan and implementing it decisively will produce superior results.
Twitter: @fabiancapital
No position in any of the securities mentioned at the time of publication. Any opinions expressed herein are solely those of the author, and do not in any way represent the views or opinions of any other person or entity.


