The S&P 500 (SPX) just closed at another new all-time high today. We’ve heard a lot how new all-time highs are a reason to be worried. Been hearing that for over a year now actually.
Sure, major peaks took place in 2000 and 2007, but the reality is we saw a lot of new highs made in the meantime. In fact, last year there were 45 new highs, so along with the 30 this year, you’d have been pretty well off to start buying that initial breakout last year with 20/20 hindsight.
Steven Russolillo of the Wall Street Journal called me on Friday and we talked about the relevance of new highs. Fortunately, he quoted me in the Wall Street Journal’s blog MoneyBeat yesterday discussing why new all-time highs aren’t anything to get worried about.
Here’s and excerpt and quote from that piece:
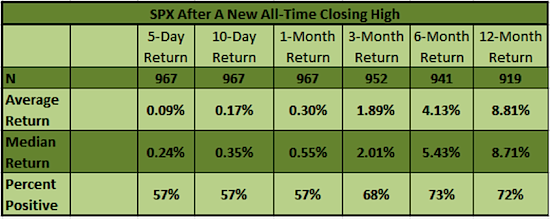
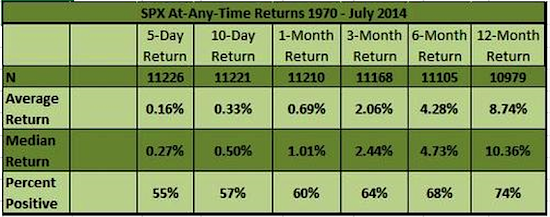
In a three-month time frame following a record high, the S&P 500 averages about a 2% gain, according to Ryan Detrick, a strategist at See It Market, a research site. That’s essentially equivalent to the market’s average performance over any three-month period, he said. The same goes for average six-month and one-year performances following record highs, which are also comparable to the market’s typical returns during those time frames.
“New highs might seem like this big event, but they don’t really suggest anything special,” Mr. Detrick said.
Getting to the returns, according to Yahoo Finance data, there have been 970 new all-time highs since 1950. Looking at the returns after you’ll see the returns are pretty much in-line with the average returns. In other words, new highs aren’t this bearish event that so many will have you believe. Now they aren’t a screaming buy either, in fact, I’d say they are a non-event. Sure, they are fun to talk about, but really they don’t mean a whole lot statistically.
A fun stat is the S&P 500 peaked at 31.30 on 9/3/29 and didn’t close above that level again till 9/16/54. This comes out to just over 25 years or 19,983 calendar days. Fortunately, we haven’t seen anything like that in quite a while.
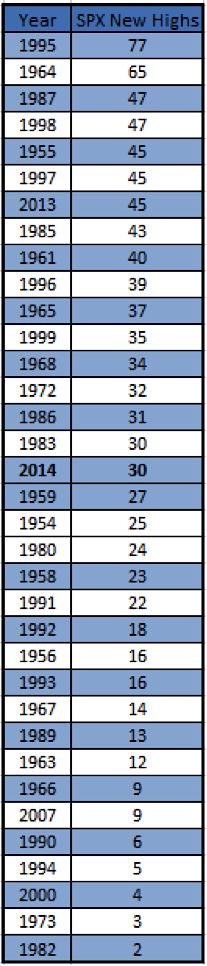
Now here’s a chart of all the years with the most new all-time highs. Last year had a very solid 45, but the all-time record is 1995 with a very impressive 77. With five more months to go, 2014 could steadily continue to climb higher in the record books.
Lastly, here’s the same data, but in a different, more visual form. I really like this one.
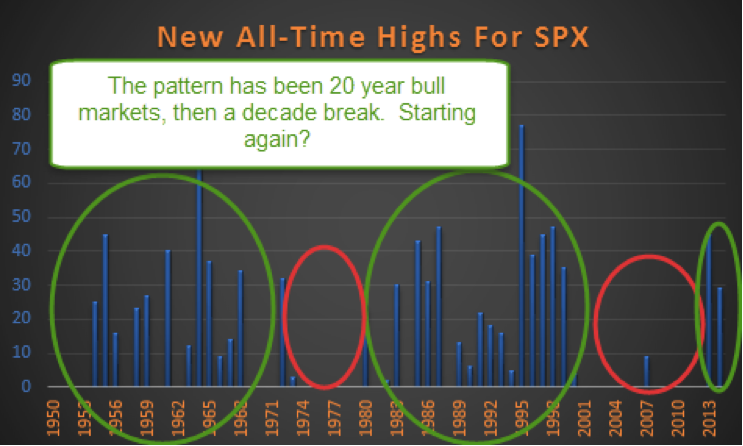
What is interesting on this is new all-time highs come in clusters. We saw a lot in the ‘50s and ‘60s and very few in the ‘70s. Then had a bunch in the ‘80s and ‘90s, with only a few last decade. Now in the ‘10s we are starting to see new highs show up again. So the pattern is 20 years of new highs, then a decade of nothing. I’m not saying we have another 15 years of new highs coming, but that is the pattern. Interesting, huh?
No position in any of the mentioned securities at the time of publication. Any opinions expressed herein are solely those of the author, and do not in any way represent the views or opinions of any other person or entity.


