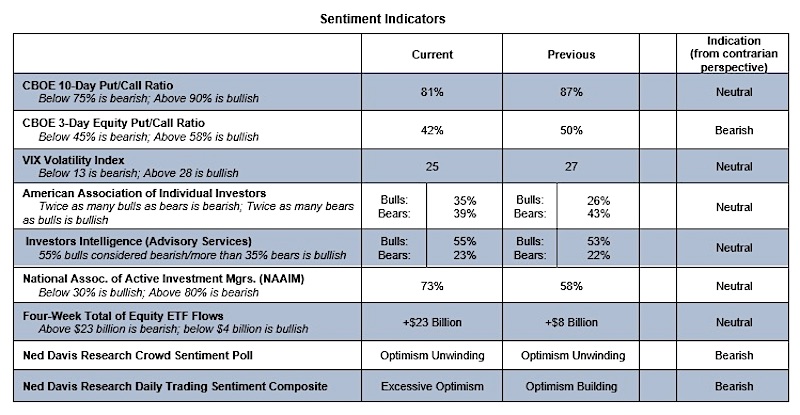
Over the past week, I am seeing evidence of increased optimism and complacency by investors. This could be an early warning sign.
Put/call ratios moved lower (especially on an equity-only basis), both the AAII and Investors Intelligence surveys showed an uptick in bulls, equity ETF inflows surged and the NDR trading sentiment composite moved back into the excessive optimism zone. September price weakness allowed optimism to unwind, but we never really saw evidence of much pessimism (certainly not widespread or excessive). The quick rebuild in optimism is keeping sentiment an overall bearish influence on stocks from a weight of the evidence perspective (look for a refreshed version of this later in the week).
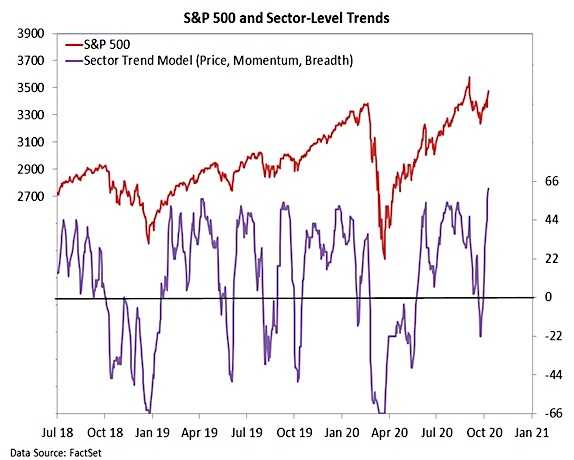
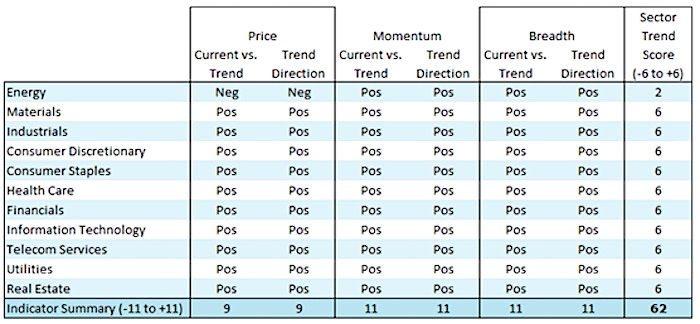
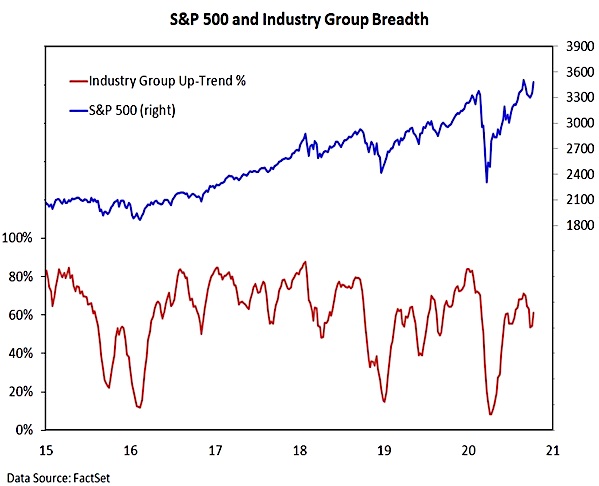
While we saw index level strength last week (S&P 500 Index closed up 4%), the bigger story was what happened beneath the surface. After nearly stumbling in September, market breadth has turned around in October. Our sector-level trend indicator shows virtually all areas of the market rallying. Industry group trends are expanding, though a failure to eclipse the early September peak would reinforce the pattern of lower highs. The Value Line Geometric Index has surpassed its early September peak and is just the June blow-off high. Three-quarters of the stocks in the S&P 500 Index are trading above their 50-day averages – the same percentage are above their 200-day averages. New high lists are expanding and breadth thrusts are firing. This may be signaling a long-awaited shift from narrow mega-cap market leadership to a broader small cap-led cyclical rally. That would not be a unwelcome development.
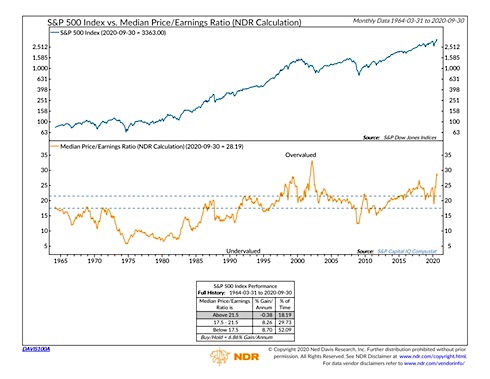
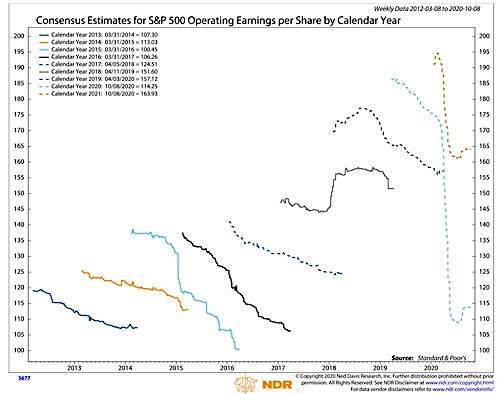
Price strength is putting renewed pressure on stock valuations. Relative to corporate bond yields, stock market valuations are not out of line (neither cheap nor expensive). On an absolute basis, however, all of the net gains in the S&P 500 Index over the past 50+ years have come when the median P/E ratio for the S&P 500 Index is below 21x. Currently its at 28x. Consensus expectations are for a swift rebound in earnings in 2021 (back to new highs), suggesting a lot of economic good news is already reflected in this market. All else equal, if valuations move from neutral to bearish in the weight of the evidence framework, the overall score will move from 0 (neutral) to -1 (bearish).
Twitter: @WillieDelwiche
Any opinions expressed herein are solely those of the author, and do not in any way represent the views or opinions of any other person or entity.


