 The stock market has been pretty choppy to begin the New Year. Could this be a deflationary signal? Stocks have see-sawed up and down on weaker than expected earnings news and global economic reports that clearly have investors feeling uneasy. After a move of greater than 30% in the SPDR S&P 500 ETF (SPY) last year, it can be an uncomfortable feeling to watch stocks consolidate near the highs. Right now the technical picture is still positive and the uptrend remains intact, however the risk of a correction is still an ever present concern.
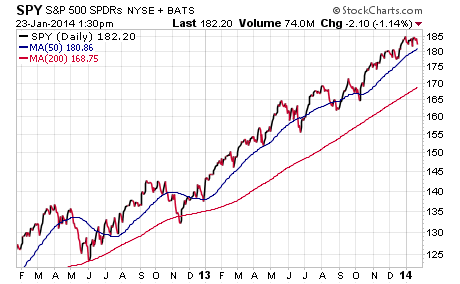
A look back on a 2-year chart of SPY shows that the market has now been above its 200-day moving average for more than a year now. That is a long stretch of time considering the volatility that we have experienced over the last decade. 2013 seemed to be an outlier year, with stocks receiving the gift of strong momentum on the back of outflows from commodities and fixed-income.
The natural ebbs and flows of the market dictate that we will eventually see a return of selling pressure that will shift assets in new directions. While I don’t advocate trying to call a top in stocks, I think that it is a good idea to watch for signals of deflationary trends. This will allow you to make incremental shifts in your asset allocation within the framework of a risk management game plan. That way you can stay ahead of the curve and shield your portfolio from a portion of volatility.
The most well-known barometer of a shift from “risk on” to “risk off” behavior is long-term Treasury bonds. The iShares 20+ Year Treasury ETF (TLT) is typically a leading indicator of investors looking to shift money from stocks or cash to high quality instruments that favor a deflationary environment.
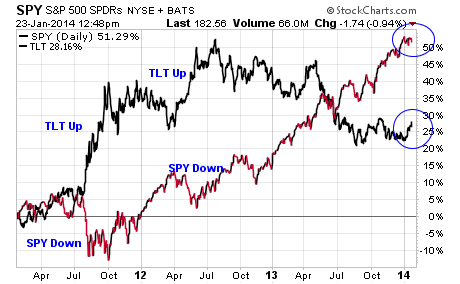
Since the beginning of the year, we have seen a noticeable uptick in the price of TLT which may be a signal that investors are looking to shelter profits from a potential correction in stocks. It may also be a sign of value seeking income managers looking to add more duration to their portfolios in order to play a falling interest rate thesis. So far the initial reaction of the Fed’s tapering have had little effect in pushing rates higher, which will likely calm the bond markets and give renewed confidence in quality fixed-income as a short-term safety trade.
Another area that may not have as strong of a safety correlation as Treasuries, but is still worth noting is Gold. The SPDR Gold Shares ETF (GLD) tracks the daily spot price of gold bullion and had a rough 2013 with a decline of over 28%. However, if we see a wave of selling in stocks, I would not be surprised to see a shift from equities to precious metals. This ETF has already appeared to gain some momentum off its recent lows and just recently hit a new year-to-date high.
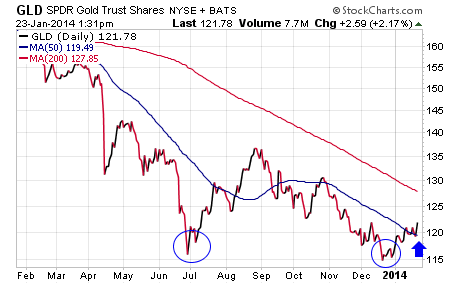
There is a case to be made for a return of this beaten down asset class as an alternative to cash or treasuries for diversification and non-correlated returns. While gold doesn’t pay a yield, it does offer a unique alternative to hide out when global uncertainty rears its ugly head. This is definitely a sector that you will want to keep your eye on.
The last indicator that I will turn your attention to is the price action of market leaders. Last year we saw small cap stocks, solar names, biotech companies, and consumer discretionary sector act as the growth engine for double and triple-digit gains. The SPDR Consumer Discretionary ETF (XLY) just recently broke back below its 50-day moving average which is a yellow flag that strength may be waning.
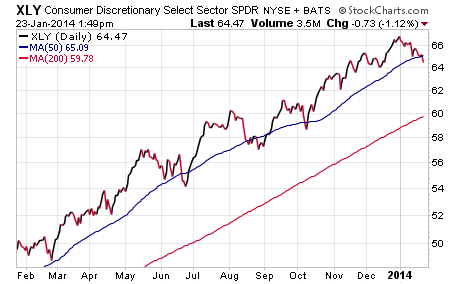
Often times these high beta areas start to show the first signs of weakness when the market begins to roll over as the early money exits and locks in gains. A rotation from high growth companies to low beta sectors is another deflationary warning sign that we may experience a pullback in the broader market.
No matter how you ultimately decide to structure your portfolio in the coming months, it’s worth keeping an eye on these select ETFs to enhance your decision making process. They may ultimately act as a “canary in the coal mine” if we do see a broad-based pullback develop. I view a modest decline in equities as an opportunity to add to core holdings with the caveat that we continue to hold above the long-term moving averages.
If you are concerned about deflationary headwinds and the potential for a stock market correction, you can start making select changes to insulate your portfolio. That may include selling down highly appreciated positions to reduce your equity exposure and add to your cash allocation. Another strategy might entail adding quality fixed-income holdings to offset equity risk. Even small adjustments can make a significant impact on reducing the volatility of your accounts and enhance your total return.
Note that this article was published as a blog on FMD Capital Management. Twitter: @fabiancapital
No position in any of the mentioned securities at the time of publication. Any opinions expressed herein are solely those of the author, and do not in any way represent the views or opinions of any other person or entity.


