The sharp V-shaped bottom rally for the S&P 500 (SPX) has given bulls a renewed sense of optimism. And several stocks have not only regained their losses but have also begun new trends. As well, the bond market appears to have put in a top of sorts in late October. So all is good, right? While it is counterproductive to argue with the market, it is always good to consider intermarket analysis and perspectives to arrive at a macro picture of the market sans emotion.
Equities
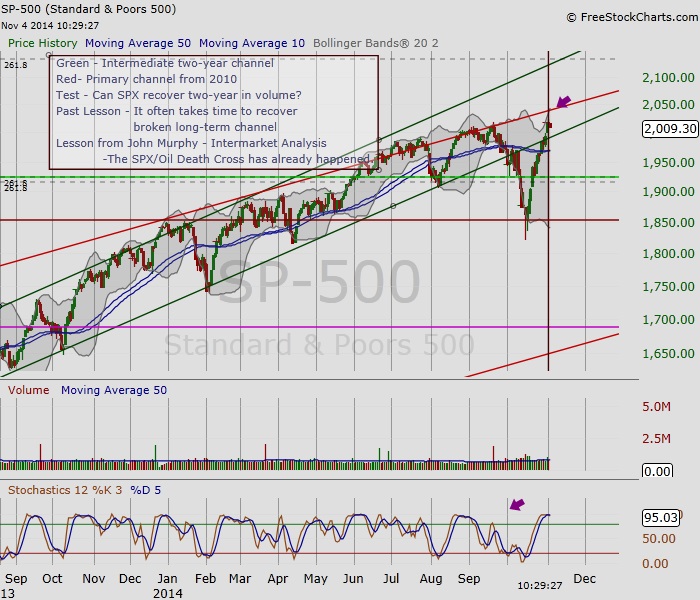
Below is the daily chart of the S&P 500. As you can see, SPX is approaching the 4-year primary channel in bright red. The dark green channel is the intermediate channel in which the SPX has traded since late 2012. In early October, the S&P 500 fell out of the intermediate channel for the first time in two years. What we’ve observed when a vehicle falls out of a long-term trading pattern is that it often takes time or convincing for the general market to regain confidence. Notice that the band between the primary and intermediate channel has narrowed, giving very little wiggle room before both sides of this argument will need to reconsider their positions.
Daily Chart of the S&P 500 (SPX)
Bonds
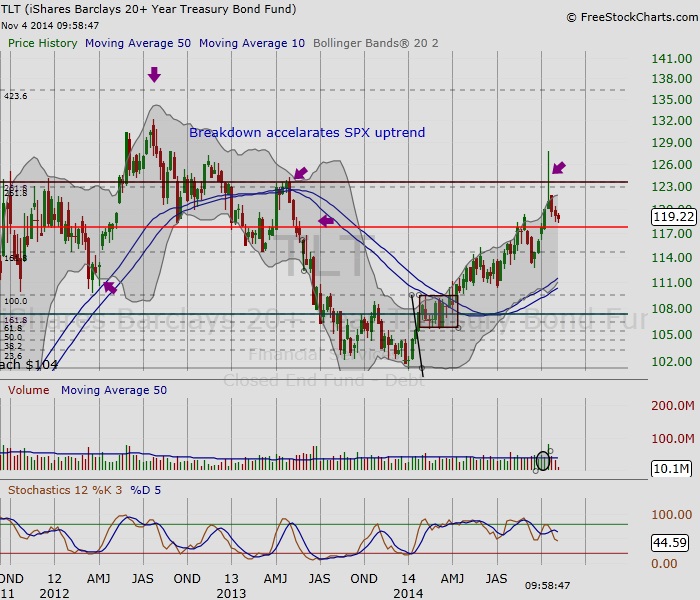
The 20+ Year Treasury (TLT) recently entered a tight band. Last month, I shared that it was time for the market to question its intuition about the economy today versus where we were in 2012. The recent answer we’ve been given by bond traders, via the technical signal of the shooting star with volume, is that the economy is not deteriorating to crisis levels. Instead, interest rates are back, a sign that demand and growth have returned. Rising interest rates, as shared in September at TraderPlanet, is a positive signal for the banks. However, observing the TLT’s behavior in recent years, it is worth noting that it has entered a tight band between 119-123. Should the TLT continue to trade within this band, we can expect corresponding indecision to show itself in the equities market.
Weekly Chart of the 20+year Treasury (TLT)
Crude Oil
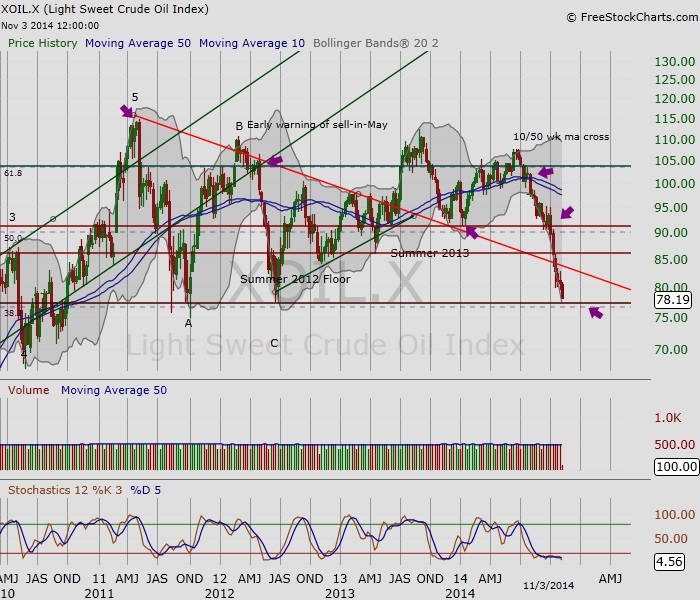
Finally, let’s look at Crude Oil. Like the TLT, light crude futures are back at their 2012 levels. Once again, the market will question its intuition about the economy in comparison to then and today. From the hand the bond traders have shown, this is likely a low for light crude futures. However, before equity traders take this as a bullish sign, recall the lead/lag intermarket relationship of oil and equities. It is oil that often bottoms first, not equities.
Weekly Chart of Light Crude Futures
Take Away
Bond and oil traders tell us that we are likely not headed to the crisis levels of pre-2012. However, it is important to note that equities tend to lag when it comes to the intermarket dance. While oil traders began to see slacking demand this summer and bond traders saw a slowing in interest rates (growth) last fall that corresponded to a sector rotation from materials to energy, the equities market — made up of sectors across the business cycle — may still need to resolve its positions to date.
You can read my most recent study on Sector Rotation here. Thank your for reading.
Follow Maria on Twitter: @rinehartmaria
No position in any of the mentioned securities at the time of publication. Any opinions expressed herein are solely those of the author, and do not in any way represent the views or opinions of any other person or entity.


