“This is a narrowly-led mega cap bull market.”
I can’t tell you how many times I heard myself saying those words at some point over the last couple years. I’ve repeated it so many times that I just assumed it has continued.
A deeper look at the small cap stocks to large cap stocks ratio, however, shows that the relationship between these two cap tiers has changed. In fact, this week shows that the strength may be tilting away from large caps and into small caps through year end.
The long-term trend of large over small has been in place for years. A ten-year chart of the ratio of the Russell 2000 ETF (IWM) to the S&P 500 ETF (SPY) illustrates this general tendency for small caps to underperform.
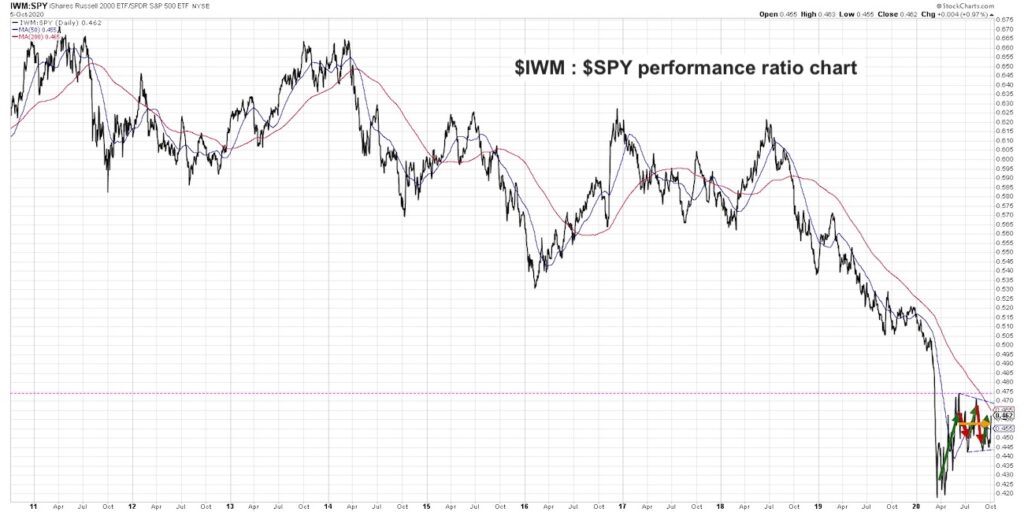
At certain points since the 2009 market low, small caps have managed to improve on a relative basis. In 2013 and 2016, for example, we saw smaller companies outpace larger companies by a sizeable amount!
But if you start the clock around mid-2018, the trend has clearly been in favor of large cap stocks. This is when I started to recognize the staying power of this trend and began to note that there was little reason to overweight small caps in the face of consistent underperformance.
Here’s a one-year chart of $IWM to $SPY performance ratio:
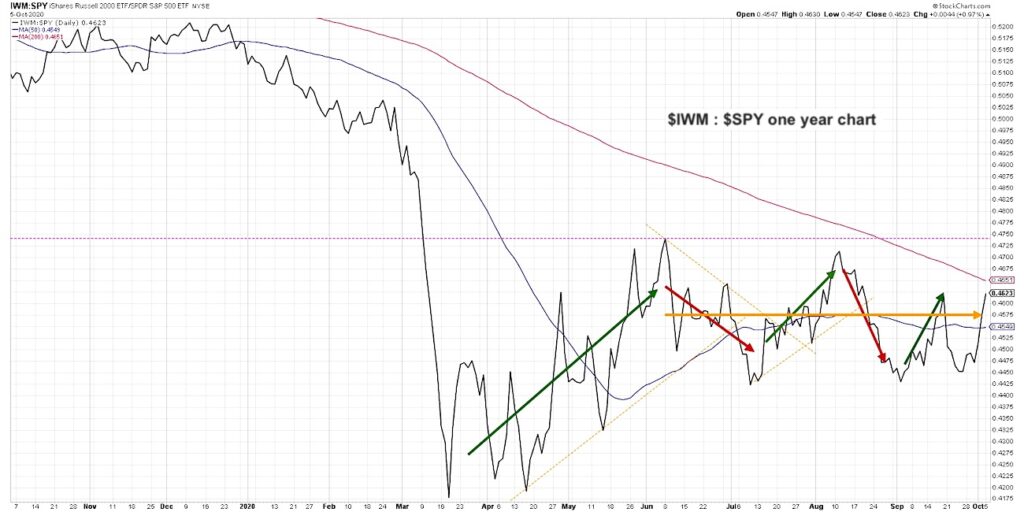
The year 2020 has provided a potential turnaround in this relationship. Small caps underperformed going into the March market low, which is perfectly reasonable given investors trying to get defensive during the downturn. From late March to the market peak in early June, small caps outperformed, which again makes perfect sense based on investors re-risking as the market recovered.
Since early June, this ratio has been essentially flat. There has been a short-term cyclical rotation between the two, but overall the ratio has been dead even. Small and large have been moving in lockstep.
Three takeaways from this analysis:
First, the whole “mega caps are driving the uptrend” idea does not seem to be supported by the evidence. Now if we’re talking specifically about the FAANG stocks and their consistent outperformance, that is a different story and that trend has remained positive. But I have tended to generalize to a broader “large over small” theme and that is not what we’ve actually experienced.
Second, this tells me to look more broadly for ideas, especially outside of large caps. There are stocks across cap tiers breaking out, just as there are plenty breaking down as well. This speaks to the importance of scanning for price movements and having a consistent routine to uncover improving charts.
Finally, the ratio has just broken above its 200-day moving average for the first time since October 2018! Perhaps this is the beginning of a much larger trend of small cap outperformance leading into year end and further into 2021.
For now, I’m encouraged by small cap outperformance and eager to broaden my perspective to find promising charts.
To see this article in video format, check out my YouTube channel!
Twitter: @DKellerCMT
The author may have a position in mentioned securities at the time of publication. Any opinions expressed herein are solely those of the author, and do not in any way represent the views or opinions of any other person or entity.
")


")
