From the examples we have looked at in previous articles it is apparent that there are a number of factors which significantly affect the Equity Risk Premium (ERP).
Dimson et al (2002 p.193) say that the ERP “is often described as the most important number in finance. Yet it is not clear how big the equity premium is today or how large it has been in the past”.
In previous articles we have seen how difficult it is to quantify it. They go on to point out the deficiencies in some of the estimates of a prospective Equity Risk Premium, such as variation in time periods chosen, using arithmetic or geometric means and a focus on one particular market. From this aggregated information, an average is generally taken.
In these articles I have focused on one particular market, the UK, but hope that the evidence points to the fact that in a global environment, the Equity Risk Premium is subject to macroeconomic and political pressures which ensure reasonably close correlation between stock indices and gilts/bonds. To illustrate this point, Figure 1 below shows the movement of the FT All Share, Dow Jones, NASDAQ and S&P500:
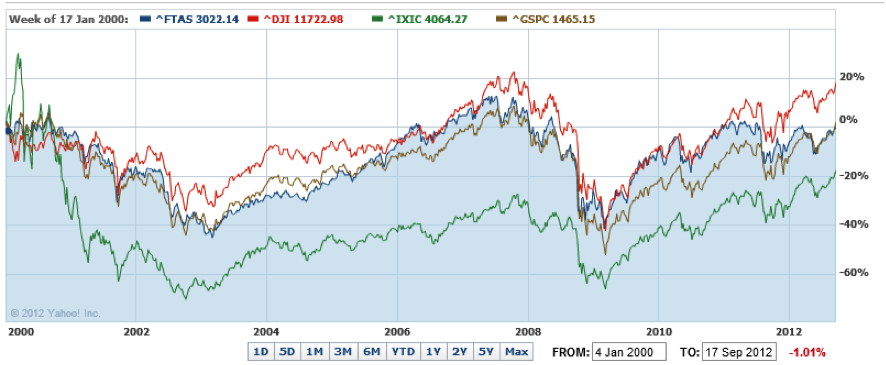
Figure 1: Indices Correlation (Source: www.uk.finance.yahoo.com)
The NASDAQ is represented by the green line and the S&P500 by the brown line. The FTSE All Share and Dow Jones are in blue and red respectively. We shall look more closely at the NASDAQ soon but this chart represents how the indices in the UK and the USA are fairly closely correlated. This point is evident when we look at the last two significant events to hit the financial markets; the Eurozone Crisis and the Global Financial Crisis, the recent movements on all of the indices demonstrate the closely correlated movement. In an earlier article we examined the impact of behavioural economics on the Equity Risk Premium and this is also relevant to estimating a future Equity Risk Premium. If we use historical data in an attempt to predict the future then we are at the mercy of the madness of the crowds. This term was created by Burton Malkiel in his seminal work A Random Walk Down Wall Street (2012 Rev. Ed). In this work we are using the FTSE All Share index but as an example of how mad crowds can be, Malkiel uses the NASDAQ Composite Stock Index to explain the impact of the DotCom bubble at the beginning of the century. The index peaked at just over 5,000 in early 2000, having been just under 2,000 in late 1998. When the bubble burst, it landed at 1,500 in early 2002. Figure 2 demonstrates the impact of these events and the level of the NASDAQ at the end of 2011:
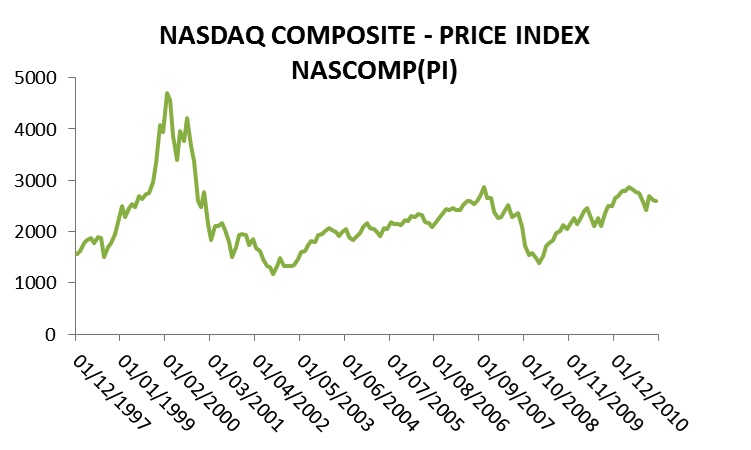
Figure 2: NASDAQ Composite 1997 to 2011
This readjustment has serious implications for the risk premium, both in the short and long term. Malkiel uses the example of Cisco (CSCO) to make his point. As its market capitalisation was increasing rapidly, he wrote (p.82) that “if Cisco returned 15 per cent per year for the next twenty-five years and the national economy continued to grow at 5 per cent over the same period, Cisco would have been bigger than the entire economy”. Malkiel also points out that this bubble was by no means unique, famous examples include Tulips, the South Sea Island Company and Railroads. A few years after DotCom, we then had the US Housing Crisis which sparked the Global Financial Crisis. As we read earlier, increased regulatory pressures and “myopic loss aversion” have also pushed institutional investors towards investing in bonds or gilts as opposed to equities. This also brings us back to Prospect Theory, which we also looked at in an earlier article, which describes how risk averse investors may miss out on long-term growth opportunities. We have seen that equities will outperform gilts over time, we have also seen that it is essential to choose the correct time frame and without the gift of being able to see into the future, this is difficult. On that topic, Siegel (2011 p.147) hoped that a third Chartered Financial Analysts forum on the Equity Risk Premium would be held in 2021 so that the contributors could reflect on their ERP predictions and either be “nursing our wounds or congratulating ourselves on our astuteness”. The first two were held in 2001 and 2011, the first being followed by (p.143) “two devastating bear markets”. This supports my contention that calculating a prospective ERP is extremely difficult and may require a rather large amount of guesswork.
References
- Dimson, E., Marsh, P., and Staunton, M. (2002) Triumph of the Optimists: 101 Years of Global Investment Returns Princeton University Press
- Malkiel, Burton, G.(2012) A Random Walk Down Wall Street W.W. Norton & Company Inc New York Revised Edition
- Siegel, Jeremy, J. Long Term Stock Returns Unshaken by Bear Markets Rethinking the Equity Risk Premium (Edited by P. Brett Hammond, Jr., Martin L. Leibowitz, and Laurence B. Siegel) Research Foundation of CFA Institute (2011)
Twitter: @MillarAllan @seeitmarket
Any opinions expressed herein are solely those of the author and do not in any way represent the views or opinions of any other person or entity.

: Showing Some Signs of Emerging Strength")
