Ever seen an Abandoned Baby before?
The Bearish Abandoned Baby candlestick pattern is a relatively rare multi-candle construction, particularly on the daily chart of a highly liquid stock or ETF.
The reason for its rarity: the sequence of the Bearish Abandoned Baby denotes a market that very neatly cycles through unabashed bullishness (Day 1), perfect indecision (Day 2), and dire bearishness (Day 3) – all with no overlap of trading range in between sentiment and the resulting auctioning between buyers and sellers remains cleanly compartmentalized. Few instruments (as described above) make so resolute a turnabout so flawlessly.
And yet, the latter half of last week featured just that on the Industrials SPDR ETF (XLI).
Here’s a look at the Bearish Abandoned Baby that characterized XLI beginning with an initially favorable reception following Wednesday’s FOMC decision, along with its classification criteria. (click image to zoom)
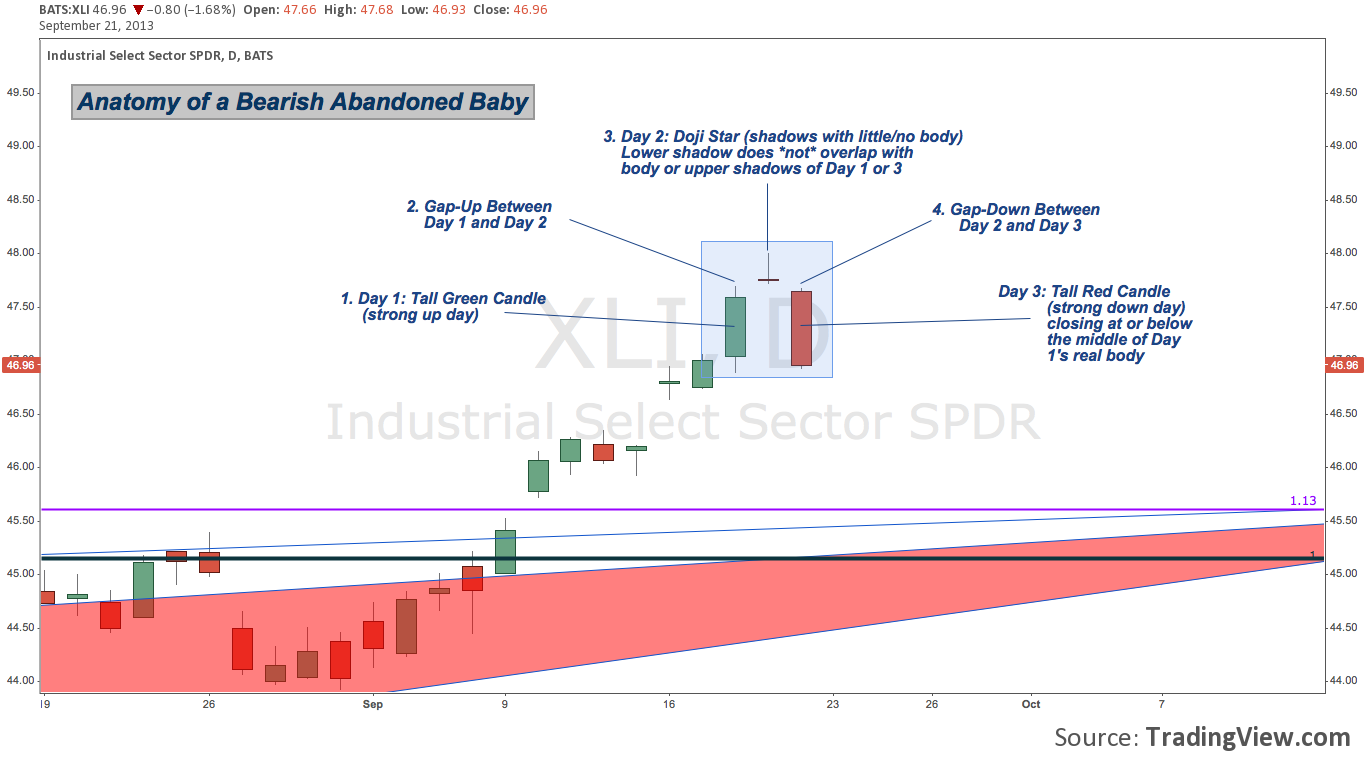
As the name suggests and the pattern intimates, the Bearish Abandoned Baby candlestick pattern anticipates lower prices. In the case of XLI, with Day 3 a near Red/Black Marubozu and swallowing up Day 1’s range in resemblance to a Bearish Engulfing pattern, this particular pattern reinforces the dire reputation of its textbook archetype.
Similar patterns, such as the evening doji star unfolded across the S&P 500’s (SPX) sectors during the stock market’s volte face last Wednesday-Friday. You can check out a full breakdown of the latter week mayhem with a comprehensive S&P sector review right here on See It Market.
Twitter: @andrewunknown and @seeitmarket
Author holds no positions in instruments mentioned at the time of publication.
Any opinions expressed herein are solely those of the author, and do not in any way represent the views or opinions of any other person or entity.
: Worrisome to Broader Market?")

: Important Breakout Retest")
