Precious Metals have been strong this month and have metal heads excited for next year.
One gauge that I use to highlight the strength of Gold is the ratio of the price of an ounce of Gold to the US Dollar Index. And today’s chart shows why we could be at a critical trading point.
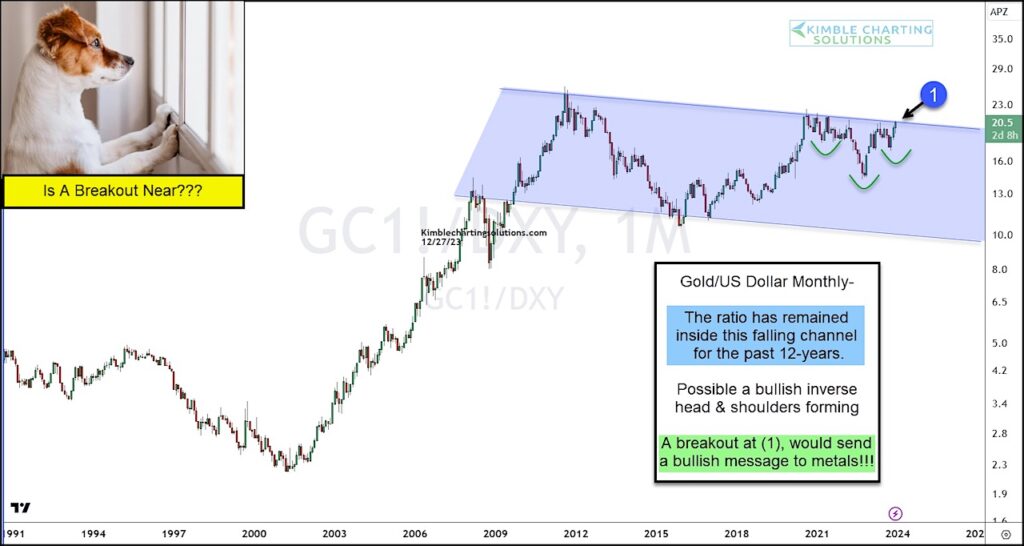
Below is a “monthly” chart of Gold vs the US Dollar ratio.
As you can see, the Gold/US Dollar ratio remains inside the long-term falling channel. Perhaps a giant flag.
The ratio is testing the upper end of this falling channel at (1).
If/When the ratio breaks out, it will send a very strong positive message to the precious metals complex and investors. Stay tuned!
Gold / US Dollar Ratio “monthly” Chart
Note that KimbleCharting is offering a 2 week Free trial to See It Market readers. Just send me an email to services@kimblechartingsolutions.com for details to get set up.
Twitter: @KimbleCharting
Any opinions expressed herein are solely those of the author, and do not in any way represent the views or opinions of any other person or entity.


: Showing Some Signs of Emerging Strength")
