Today’s article takes a quick look at implied volatility cycles to forecast future turbulence in the stock market, particularly in October.
In the chart below you can see that cycles analysis of the VIX Volatility Index INDEXCBOE: VIX show a very pronounced upturn in implied volatility to start the month of October.
And that is worrisome for investors.
Why? Because it also lines up with a decidedly downward slope for the broad stock market index, the S&P 500 Index INDEXSP:.INX.
Investors Should Respect the Implied Volatility Cycles
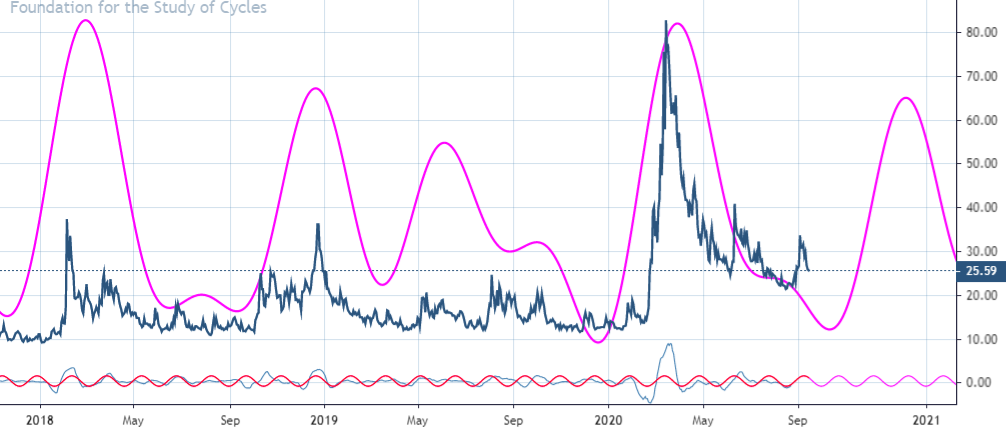
The chart is creating by utilizing three of the most accurate cycles since 2010 along with the current dominant cycle that covers the last three years.
It is noteworthy that all of these cycles have a fairly steep upward slope in the weeks ahead.
While the next 1-2 weeks is unclear, I will be using any further volatility compression to consider buying implied volatility. With this in mind, I expect a noticeable rally in the VIX Volatility Index by election time in November.
If you have an interest in seeing timely intra-day market updates on my private twitter feed, please follow @NewtonAdvisors. Also, feel free to send me an email at info@newtonadvisor.com regarding how my Technical work can add alpha to your portfolio management process.
Twitter: @MarkNewtonCMT
Author has positions in mentioned securities at the time of publication. Any opinions expressed herein are solely those of the author, and do not in any way represent the views or opinions of any other person or entity.


