In the last couple weeks, there’s been some noise around widening High Yield spreads. It’s fair to say that seeing High Yield spreads shrink even more will be tough.
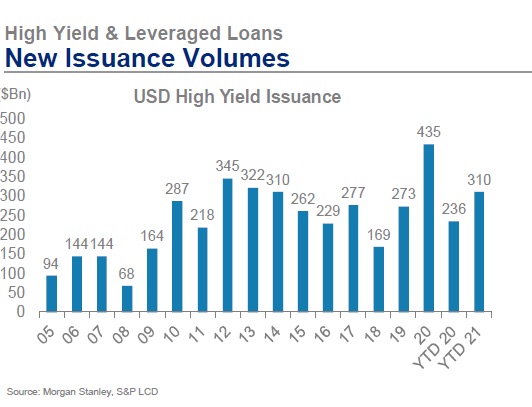
The amount of new HY issues has been crazy high all year (see High Yield bond issuance chart above) and despite the thirst for yield, one would think there’s a limit.
$CROX sold $350 million of 10 year bonds to fund stock buybacks: that’s frothy. Bonds-funded buybacks are the norm for Investment Grade companies, but pretty rare for High Yield
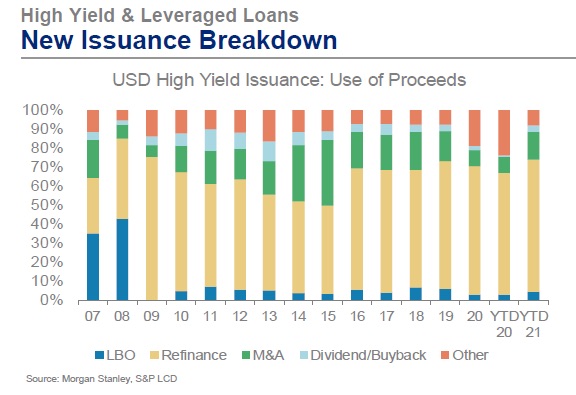
Usually, High Yield companies are forced into the Leveraged Loan space for dividend/buyback money. For that reason, with respect to how spreads may impact stocks, in my opinion the focus should be on Investment Grade (IG) rather than High Yield (HY) bonds. And currently IG demand is still outstripping supply (despite the constant avalanche of new issues). Spreads are at historic lows, and on a monthly basis, even DeMark downside exhaustion counts have not gotten much traction
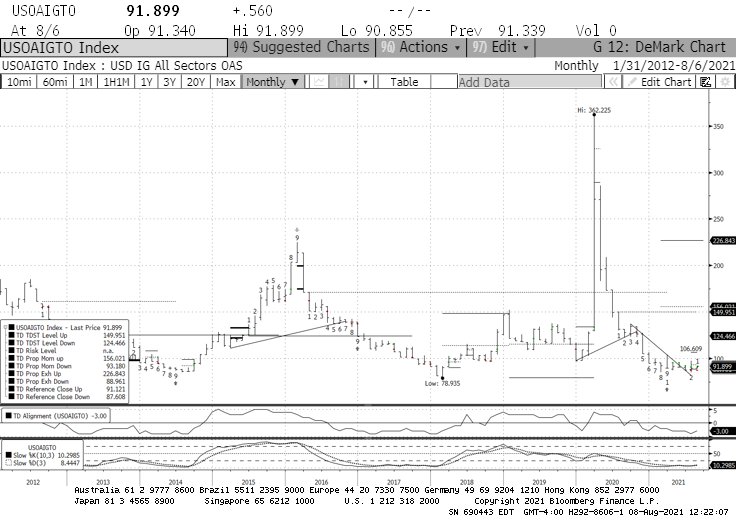
How fast credit spreads widen is as important (or more) as absolute levels with respect to impacting stocks. IG is hardly moving, and on an absolute level, anything <140bps is little more than noise. HY widened a bit this month, but at a gradual pace – It too has room to the 450-500bps area before it means anything (that’s where it was for most of 2019 as $SPY rose 30%.
To sum it up, HY High Yield spreads may provide a bit of headline risk for weak-handed longs, but there’s nothing in IG Investment Grade credit – the one that REALLY counts for stocks – suggesting even the slightest sign of troubles.
All things being equal, in my honest opinion, if stocks finally crack for > 2 days, it’s not because of credit, but because they seem wildly overbought. This can be seen by multiple DeMark upside exhaustion levels which are starting to converge.
Twitter: @FZucchi
The author may have positions in mentioned securities at the time of publication. Any opinions expressed herein are solely those of the author, and do not in any way represent the views or opinions of any other person or entity.


