I hope you did not miss my annual write-up about the upcoming Chinese New Year, Year of the Metal Rat, and how it may effect the stock market and financial markets.
As I mentioned, this year the fire element is completely absent.
Raymond Lo (my go-to source) says that pessimism, cyncicm and despair will set in and contribute to an economic decline.
Clearly, starting the week with reported cases of the coronavirus sparked some of today’s pessimism in the stock market.
Yet if Lo is correct, without the fire element and with an abundance of water, the virus might have been a catalyst, but not necessarily the main reason we could see further declines.
A few weeks ago I featured junk bonds, saying the following:

“High-yield junk bonds are attractive when the anticipation is for lower rates for a longer timeframe. Furthermore, the price of junk bonds will rise if the anticipation is that these weak companies will improve.
Junk bonds in general, serve as one indicator for investors’ appetite for risk.”
With NASDAQ 100 making yet another new all-time high early on, while closing lower, has this rally now turned into the world of expensive junk?
I’ve rarely shown you all trend lines, as I typically look at moving averages and chart patterns.
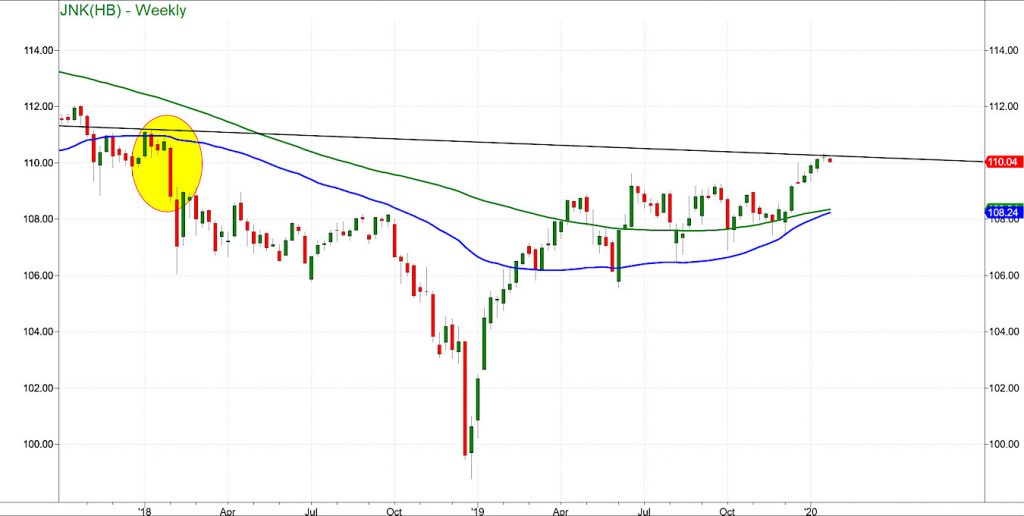
However, the trend line on this weekly chart of the Junk Bonds ETF (JNK) is extremely useful.
The black line near the ellipse extending to the recent price action is a valid trendline.
Weekly charts help us to step back and see the bigger picture.
Therefore, the trendline on the weekly chart that dates back to the beginning of 2018 and extends to today tells a story.
The 2018 high for the Junk Bonds ETF – JNK – was 111.15.
The 2019 high was 109.99. And the 2020 high thus far is 110.33.
The ETF’s price stopped right at the trend line last week.
Today, it closed red.
At this point, we cannot say this is a failure of the trend line and the end of the appetite for risk.
What we can say though, is that 110 is pivotal. A move over 110.33 will indicate a breakout with more upside to come.
And, that with a potential inverted head and shoulders bottom, the sell off today appears like more noise than anything else.
What would change the picture to out and out negative, is a break below 108.24.
Plus, should JNK get there, that will create a lot of havoc in the overall market.
Or, putting it in Lo’s language, it would snuff out the bull’s fire and flood the market with sellers.
S&P 500 (SPY) 327.73 is current price support.
Russell 2000 (IWM) Looks a bit toppy. 166.66 is a pivotal price (and a creepy number).
Dow Jones Industrials (DIA) 289.76 is the support level to hold.
Nasdaq (QQQ) Made another new all-time high by a few cents and now 220.02 is the price support to hold.
KRE (Regional Banks) Unconfirmed caution phase with 57.10 pivotal resistance.
SMH (Semiconductors) A new all-time high and closed green. 144.50 pivotal price support.
IYT (Transportation) 195 is major price support with 200 being pivotal.
IBB (Biotechnology) 120.72 is pivotal with 118.30 as price support.
XRT (Retail) 45.50-46.00 is pivotal.
Twitter: @marketminute
The author may have a position in the mentioned securities at the time of publication. Any opinions expressed herein are solely those of the author, and do not in any way represent the views or opinions of any other person or entity.


