Many people post fancy charts and data points but often times I wonder if they have actual use.
Recently, there is also a great infatuation with alternative data (myself included here). The question is – and always is – does this extra analysis actually help or is it just eye-catching noise?
One of the most popularly posted charts and reports is the Commitment of Traders report. It is weekly report published by the Commodity Futures Trading Commission (CFTC) that breaks down how different types of traders are positioned. In short, there are two types of traders in the CFTC’s eyes: those that actually produce and use the product (“smart money”) and then of course speculators (“dumb money”).
The question is… does knowing how certain traders are positioned provide any advantage to us? Of course there are a variety of use cases and answers that could apply here, but I will break down one specific example of how to use the CoT report.
I will use the CoT report as a secondary market to generate an intermarket signal to improve an existing 2 period RSI trading system for the S&P500. All of this is easily accomplished using Build Alpha. Here is an alternative example.
Below are the steps and explanation of this example:
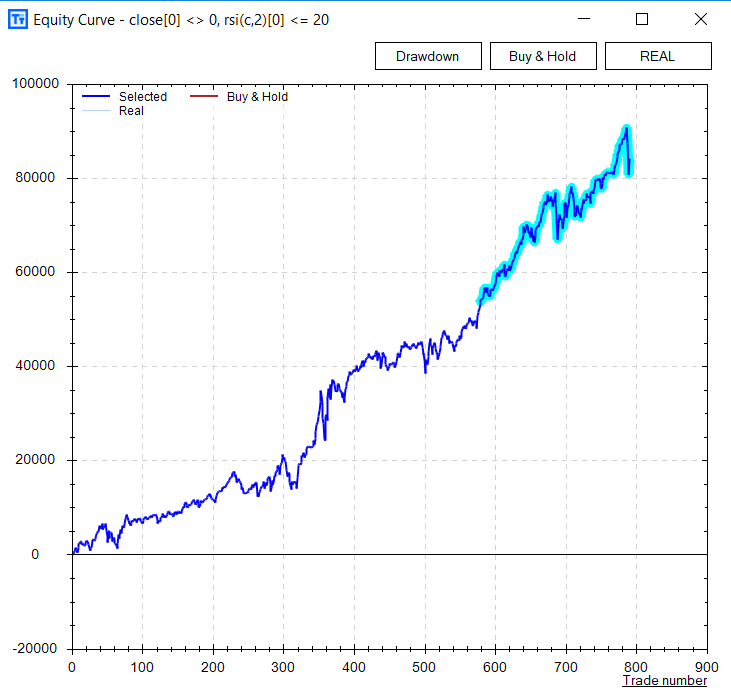
1. The existing trading system.
This simple system is meant to serve as a “baseline” to see if we can improve something using alternative data (CoT report). The trading strategy we will use simply goes long and holds for one day if the 2 period RSI is less than or equal to 20. Both entry and exit are executed on the next bar’s open. Below is the simple equity curve generated trading only 1 future contract from January 2002 to February 2018.
2. The Commitment of Traders Report
I have downloaded free weekly data from quandl.com and have gone ahead and divided all the raw values by the open interest for each data point. It is important to look at relative values as opposed to raw values. For example, say speculators are long 12,347 contracts. Is that a lot or a little? Well if total open interest is 15,000 or 95,000 then it paints a bit more clarity as to what that 12,000 actually means.
I then loaded the correctly formatted weekly CoT data into Build Alpha as market 2. I then set market 1 as daily ES data and right-clicked on the RSI(2) <= 20 signal. This “requires” Build Alpha to only build strategies when this required rule is true (this is a new feature that allows users to find complimentary and supplementary rules to a required primary rule). I then selected a few hundred market 2 signals and ran a quick simulation.
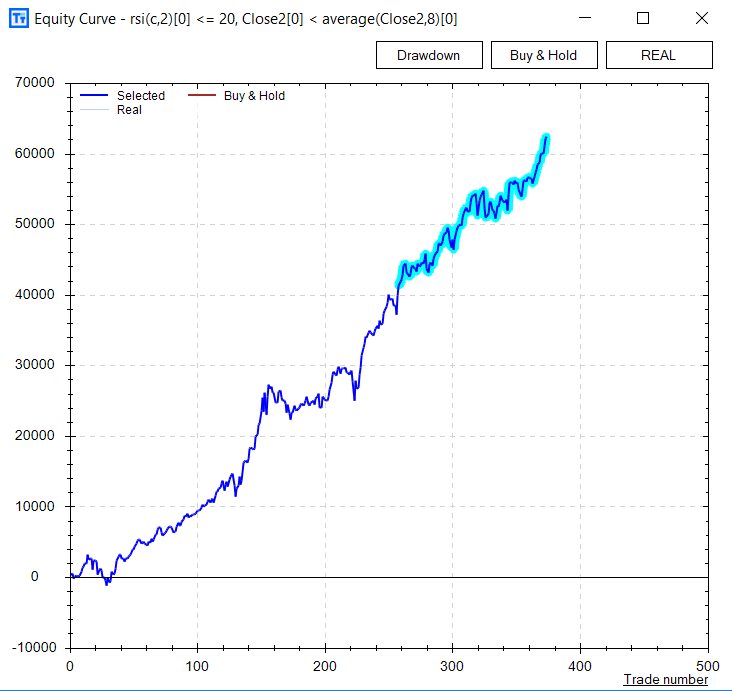
Build Alpha returned results and found a few interesting intermarket rules. Of course intermarket here means rules from our CoT data that work well with the required RSI(2) rule. The most noticeable rule was close2 < average(close2,8). *Close2 is close of data2 which in this case is CoT data*. Since I had the non-commercial longs in my close column of data 2 then this can be translated as non-commercial longs are below a simple 8 period moving average of non-commercial longs.
This filter actually makes “sense” to add to our existing trading system. It can be explained in layman terms as “when dumb money is less long than the 8 week average of dumb money then it is a good time to trade our 2 period RSI system”. In short, fade dumb money and the crowd. In other words, when dumb money was more long than the 8 week average of dumb money it makes sense to turn OFF our simple 2 period RSI system.
Here are the results of the existing 2 period RSI system with the CoT filter applied.
This is a quick and easy example showing how simple it is to create and improve a trading strategy using alternative data, intermarket signals, and multiple time frames. All of this with no programming at all. The world is changing and hopefully your analysis follows suit. Additionally here are the improvements actually quantified as often times equity curves and other visuals do not do quantitative justice.

For Build Alpha users.. I have put the data and step-by-step instructions to format in the private forum. I intentionally left them out of this post for readability’s sake but basically you just need to make CoT data in Date, Time, Open, High, Low, Close, Vol, OI format with non-commercial longs / open interest as Close data column.
Using alternative and non-price based data is very popular amongst the hedge funds I talk to. Some have used rail car weights as a barometer of the economy and of course many use sentiment, twitter feeds, and google search trends. The main takeaway is often that price based signals can often get a boost when incorporating things others might not be looking at! As always, thanks for reading.
Over at Build Alpha, I have tools that can help anyone, even those with no programming capabilities to do simple and complex testing. Thanks for reading.
Twitter: @DBurgh
No position in any of the mentioned securities at the time of publication. Any opinions expressed herein are solely those of the author, and do not in any way represent the views or opinions of any other person or entity.


