You’ve probably heard the saying “the trend is your friend until the end.” Well, for most markets these days, the trend is up. Here are a few techniques you can use to determine when that trend is ending.
A trend will first start to break down in the smallest timeframe. Many times, it will garner support before falling too far and thus resume it’s uptrend. I prefer to lean on the daily chart for a more substantial clue to a trend break.
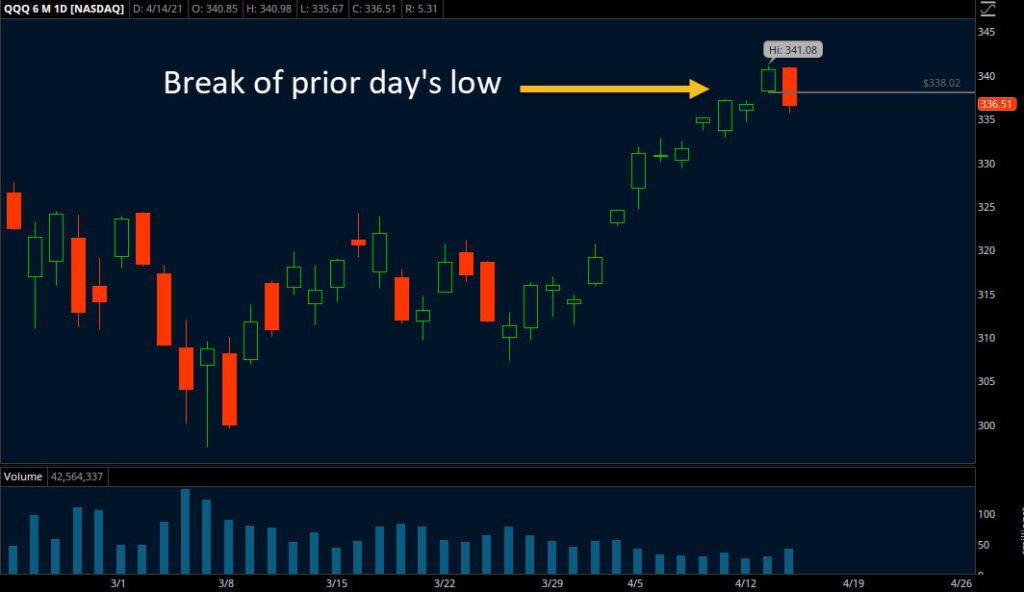
Breaking the Prior Day’s Low–Outside of an intraday trend change, the next place to look for a change in trend is when we break the prior day’s low. This is the soonest visible break on a daily chart and also makes a great spot for setting trail stops.
When long, I like to trail my stop below each candle’s low, thus exiting the trade as soon as we break that prior day’s low. If we’re in for a big selloff, it begins here.
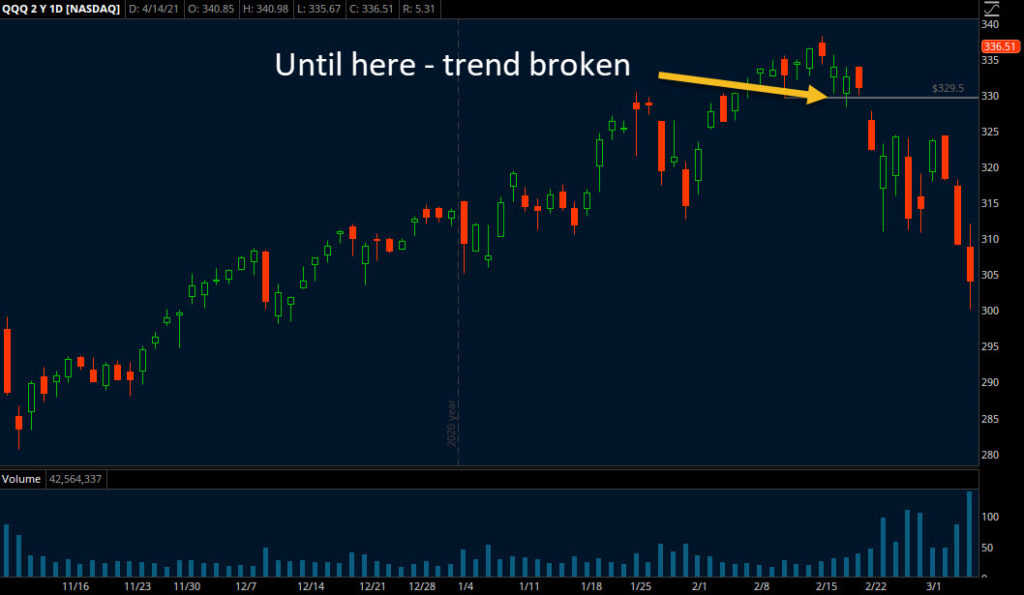
Swing Low Break–If we know that a series of higher highs and higher lows is the definition of an uptrend, then looking to the most recent swing low can signal the next logical change in trend.
This is a great way to stay in a longer term trade. I look for a visible swing low and in uptrend to use as a failure point (a swing high in a down trend in the same way).
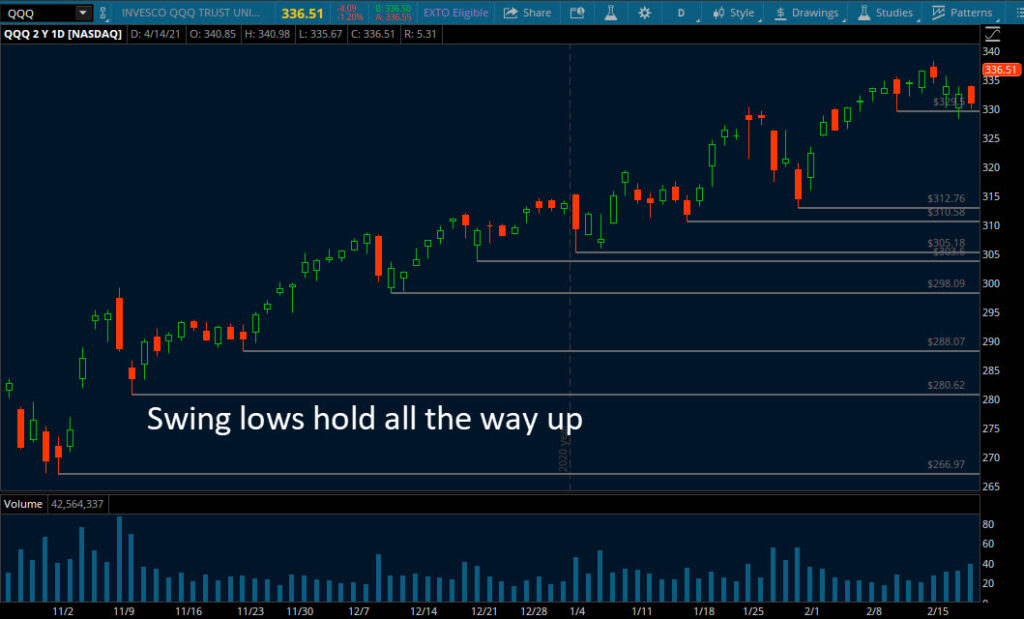
The phrase “Keep it SImple” will take you far in trading. Looking at a simple candle or bar chart for a series of higher highs and higher lows to identify the trend is a tried and true method for staying in the trend, until the end.
Twitter: @EminiMind
The author has a position in mentioned securities at the time of publication. Any opinions expressed herein are solely those of the author, and do not in any way represent the views or opinions of any other person or entity.


: Showing Some Signs of Emerging Strength")
