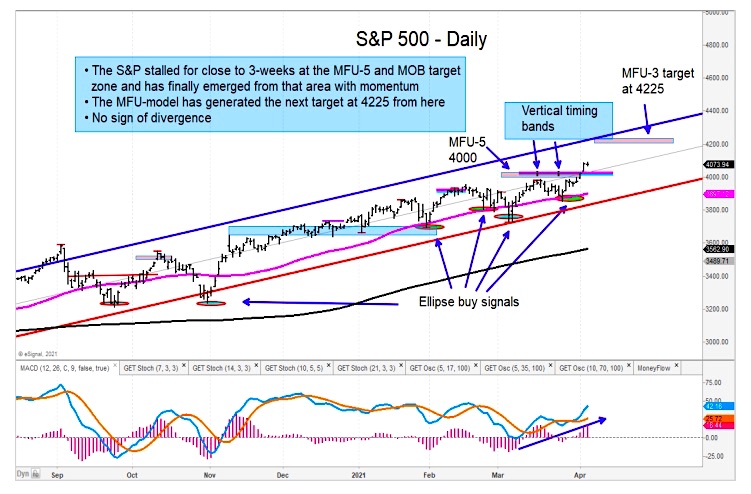
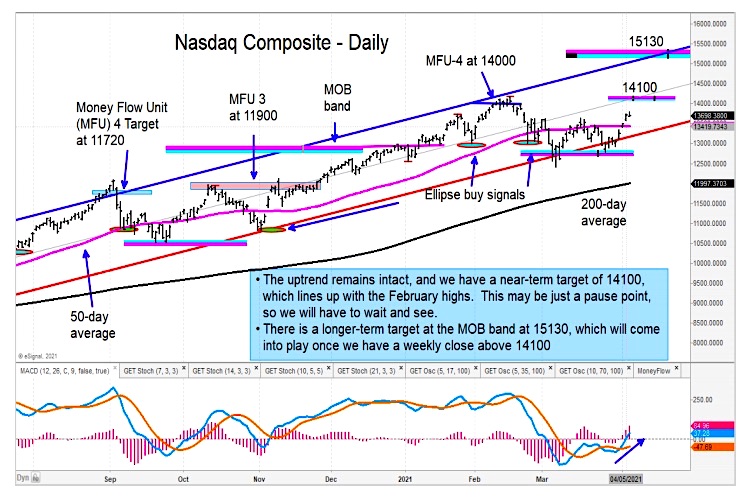
The major U.S. stock market indices are seeing strong upside momentum, especially in the Nasdaq Composite and S&P 500 Index.
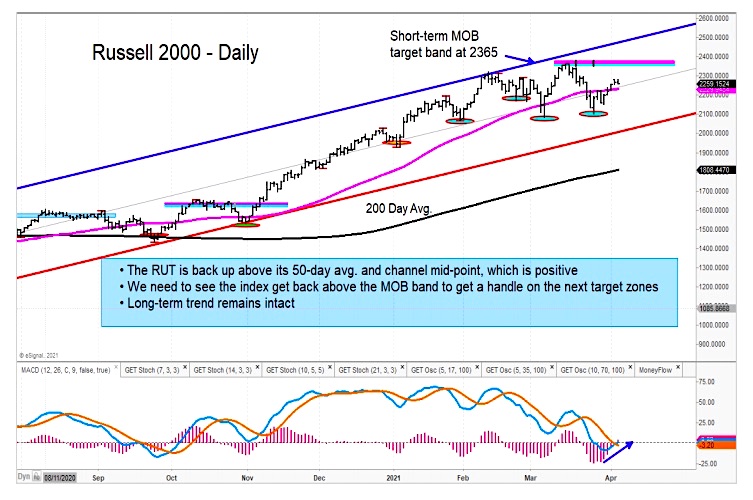
We are seeing a subdued rally on the Russell 2000 (IWM), but the index remains above support and should head a bit higher yet. The Mid-Cap ETF (MDY) is testing the upside of its channel line. Long-term trends remain intact.
The Dow Transports have been very resilient, and the index is approaching our MFU-4 target. We should be on alert for any signs of a pause or pullback.The Airlines continue to look very favorable, and we have that chart on page 9.
I have been surprised by the Utilities breaking out of its 4-month trading range. I now have an upside target zone for that group.
The chart of the Semiconductors ETF (SMH) shows the ETF approaching its next price target zone. We need to see if there will be a pause/pullback or a breakout for the next leg higher. We should know soon.
In other sectors, the Energy ETF (XOP) recently turned up from support. This is a good spot to add.
The Industrials have been in a strong trend up for 12-months. Price is getting close to an MFU-4 target, so we will be looking for signs of resistance and potential of selling.
The author or his firm may have a position in mentioned securities at the time of publication. Any opinions expressed herein are solely those of the author, and do not in any way represent the views or opinions of any other person or entity.


