 The NASDAQ rally continues to plow inexorably higher, breaking above 3400 at the end of the past week to touch levels not seen since October 2000.
Since the bottom of the Dot-Com collapse, NASDAQ 100 (Index: NDX; ETF: QQQ; Futures: NQ) has posted quite a few multi-month bull runs, with the seemingly endless persistence of the longer runs leaving no doubt where the money was made over time.
Every run eventually ended with a greater than 10% correction: in fact, all 8 noted below shed more than 13%, and 5 of 8 gave back over 17%.
So when does the NASDAQ 100 (studying NQ here) get too much of a good thing? In other words: how many months does NQ run before it loses 10% or greater?
NASDAQ Rallies (NQ) – Monthly: 2003-2013
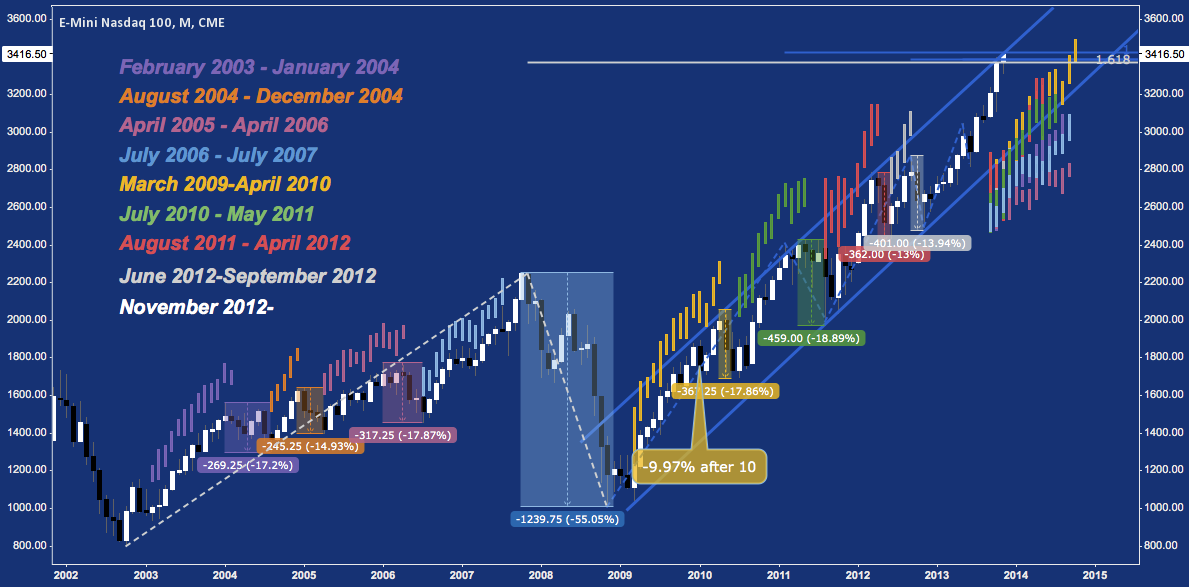
The average duration (including the present) is 10.4 months. The shortest (June 2012-September 2012) was 4 months, the longest (March 2009-April 2013) was 14. The current run is on month 13, or 2.6 months above the average.
In the upper right corner, the pattern of each bull run is super-imposed for comparison against the current period. The November 2012-November 2013 period’s range has surpassed all except March 2009-April 2010. A further 3% advance from Friday’s close would carry NQ above 3510, qualifying it as the longest span of points in the Nasdaq 100’s history without a 10% correction.
According to this metric, the NASDAQ seems to be in rarefied territory; but a study like this would be disingenuous without considering its historic advance in the late Nineties, also. So, let’s go all the way back.
Since the NASDAQ 100‘s inception on January 31, 1985, it has accumulated nine runs of 11 months or more without incurring a peak-to-trough correction of 10% or greater, all visible in the chart below. Of those 454 full months:
- It has spent 18 (4%) persisting in a trend higher for 11 consecutive months or more without a >10% correction.
- It has spent 9 (2%) persisting in a trend higher for 13 consecutive months or more without a >10% correction.
- It has spent 4 (0.88%) persisting in a trend higher for 14 consecutive months or more without a >10% correction.
Keeping in mind 3 standard deviations of a lognormal distribution falls at 99.7%, it’s evident just how rare find a NASDAQ rally in the last scenario becomes.
NASDAQ Rallies (NDX): 11 Consecutive Months or More Without a >10% Correction (click to zoom)
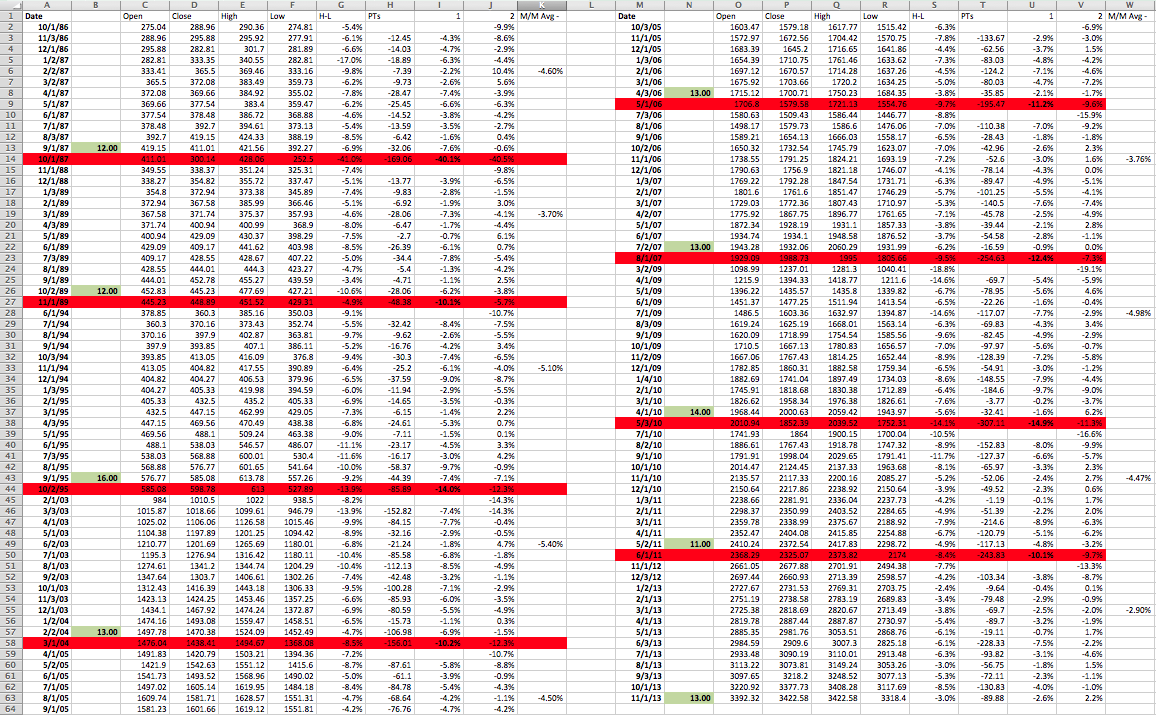
Assuming November does not close -10% from Friday’s close, the Nasdaq 100 (NDX, here) will fulfill the middle scenario, and begin work in December on the latter.
One last statistic: found in columns K and W (drawn from the values in columns I and U), its the average of the change from the high of one month to the low of the next month across each run. The current 13 month run’s volatility as measured by its month-over-month ranges is -2.9%: the lowest of the 9 (by far, with 1988-1989 next at -3.7%).
If you’ve gotten the vague feeling the rebound off of last November’s lows has been incredibly quiet: you’re right.
Twitter: @andrewunknown and @seeitmarket
Author holds no exposure to securities mentioned at the time of publication.
Any opinions expressed herein are solely those of the author, and do not in any way represent the views or opinions of any other person or entity.


