Hang Seng Index and Key Technical Levels
Events in recent days have elevated Hong Kong back into the spotlight of the global news coverage and generated new bearish forecasts for the Hang Seng stock market.
The bearishness merits a breakdown of the major technical levels of interest in our work. Refer to Chart 1.
– 2008 Rising Trendline – The index has traded up to the trendline in April and May. Clear short-term risk level (9.5% above current price) for short positions.
– 200-month SMA (21,500) – In March, the Hang Seng fell to the moving average before rebounding strongly. It would represent a decline of -6.2% from current levels. Note in January 2016 the index also found solid support in the vicinity of the long-term moving average.
– February 2016 Low (18,280) – It would represent a decline of -20.3% from current levels.
– 1998 Rising Trendline (17,920) –It would represent a decline of -21.8% from current levels.
Chart 1: Hang Seng Index – Monthly
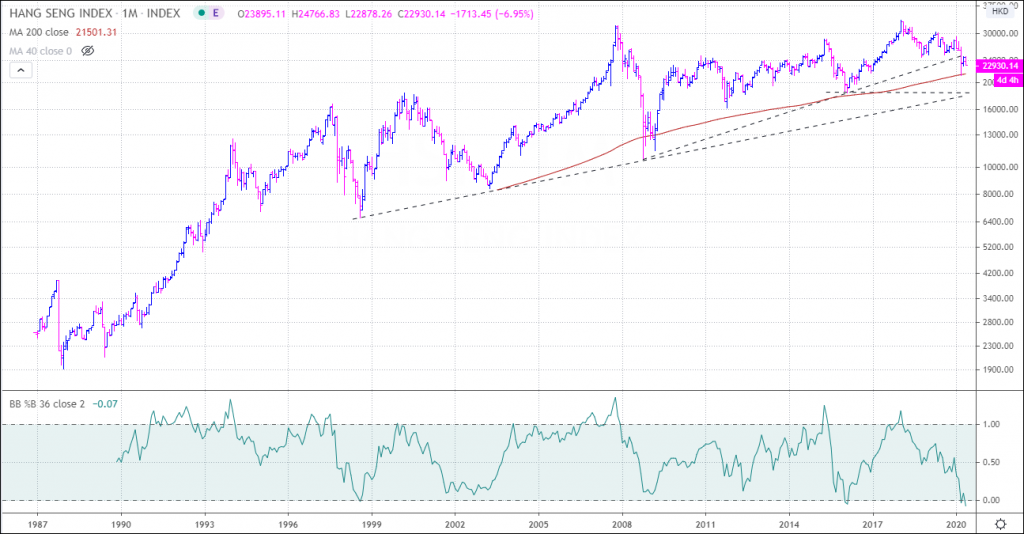
We believe the risk remains to the downside if the Hang Seng is below the rising 2008 trendline.
It is important to note that our analysis indicates that the index is the most oversold since 1987.
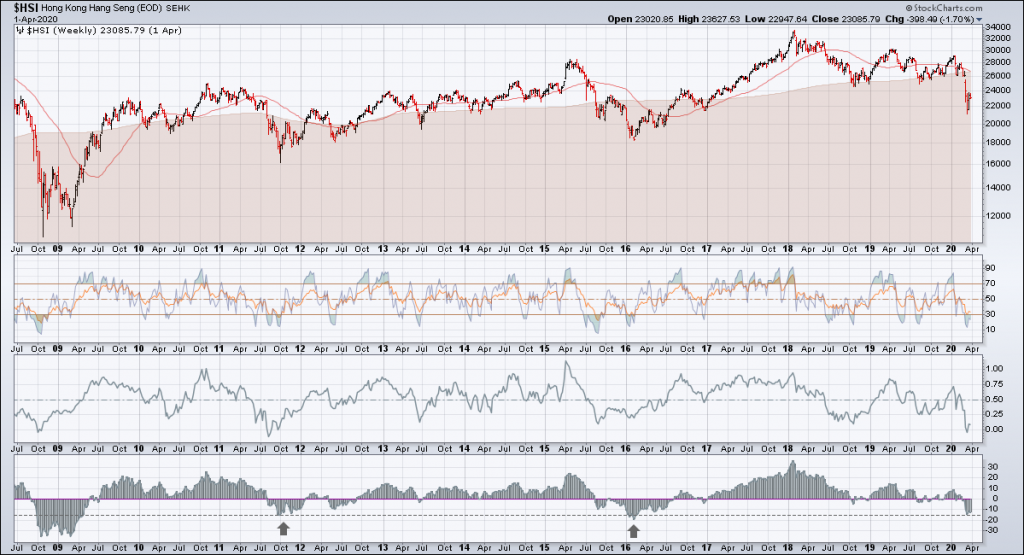
The index is also trading at a deviation from the mean (200-week sma) that matches the levels at the 2011 and 2016 price lows (refer to Chart 2). The potential for a sharp reversal on a new low is high.
Chart 2: Hang Seng Index – Weekly
Twitter: @hertcapital
No positions in any of the mentioned securities at the time of publication. Any opinions expressed herein are solely those of the author, and do not in any way represent the views or opinions of any other person or entity.


