 It’s been a banner year for tech stocks. With the Nasdaq Composite up over 37 percent, it isn’t a surprise to see shares of Google, Inc. (GOOG) excelling. In fact, on the heels a stellar 3rd quarter earnings report, shares of Google stock have been red hot, pushing the tech giant up over 58 percent on the year. That is quite a feat considering that Google’s market cap is over $370 billion. But this move higher also brings with it some caution: The recent run has landed Google stock in overbought territory. And this could limit Google’s upside into Q1 before some healthy corrective price action.
As many experienced traders know, an “overbought” stock or market can stay overbought for some time. But that said, technical indicators are useful in that they highlight the level of risk associated with buying that stock at elevated prices. Sure a stock that has run from $100 to $200 can rally further to $225, even in an extremely overbought status. But when the stock corrects to $160, were you prepared? Were you aware of how stretched it was over a given time frame? Did you have a trading plan? You see what I’m saying.
On that note, let’s take a look at the daily and weekly Google stock charts to see whether near-term caution is advised.
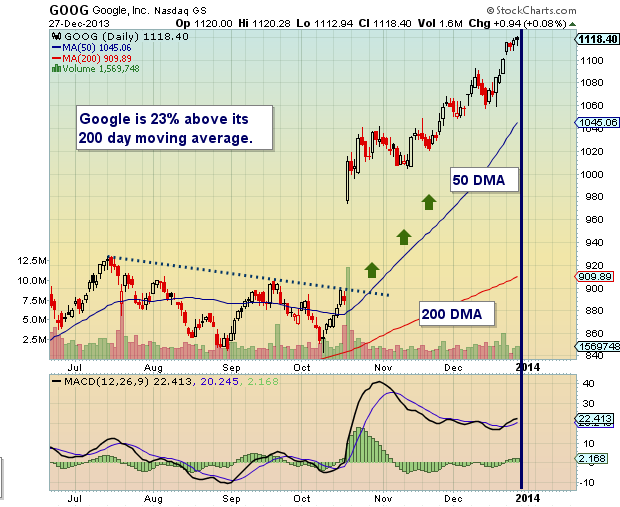
On the daily stock chart, Google had a very big breakout higher (bullish) after announcing its 3rd quarter earnings. This should bode well (fundamentally and technically) for the stock on a longer term basis, however on a near-term basis the stock is getting stretched. Currently, Google is 23 percent above it’s 200 day moving average. The past 2 occurrences came near short-term tops in May 2013 and October 2012. In late 2009 the stock rose 35 percent above its 2oo day moving average, but this was out of a trend change during the initial thrust higher (while the moving average was flattening).
Google Daily Stock Chart
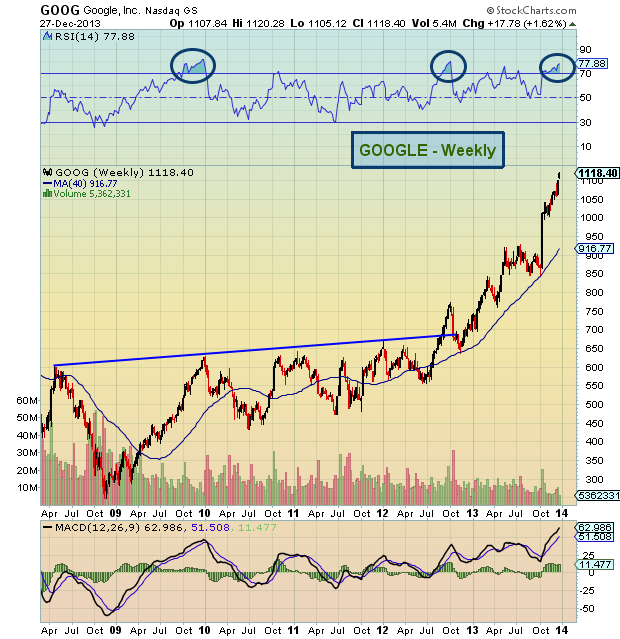
The weekly stock chart highlights the rising wedge breakout, which helped to fuel a pop to new all-time highs (over $750 in 2012), and eventually above $1000 this quarter. But the recent move higher has pushed the weekly Relative Strength Index (RSI) to 77.88, a recording last seen with the 2009 and 2012 Google stock peaks (both of which produced corrections shortly thereafter). Note that moves over RSI 70 tend to highlight a need for risk management focus. And moves nearing RSI 80 call for caution/discipline. As a side note, the 2009 stock peak registered an RSI above 80, so there’s still wiggle room to move higher. Trade safe.
Google Weekly Stock Chart – Current Bull Market
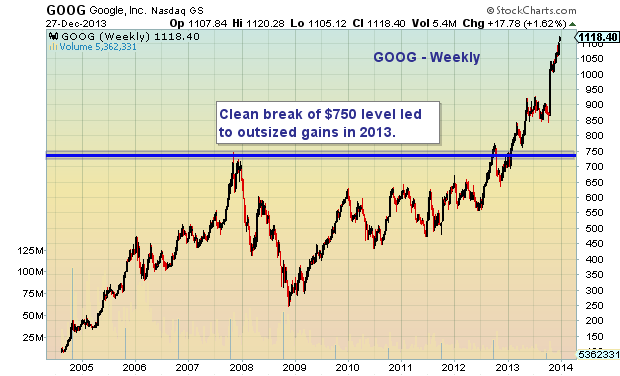
Google Weekly Stock Chart – Since Inception
Twitter: @andrewnyquist
No positions in any mentioned securities at the time of publication. Any opinions expressed herein are solely those of the author, and do not in any way represent the views or opinions of any other person or entity.

: Showing Some Signs of Emerging Strength")
