After a stealth drop in mid-January, Google (GOOG) stock soared over 20 percent into early March. And with that run higher came talk of GOOG stock price hitting $1000/share. Whether GOOG stock would or wouldn’t hit $1000/share was irrelevant.
What was relevant was the fact that many were feeling like $1000/share was inevitable. And this behavior often is a sign of caution. Since then, Google stock has fallen about 7 percent. And on Friday GOOG stock gapped below its 50 day moving average towards an important confluence of support… one that active investors should be paying attention to.
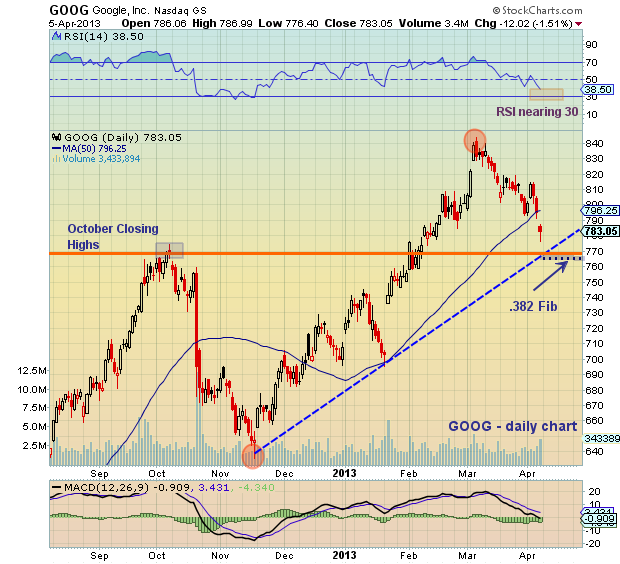
Below is a near-term chart of GOOG stock. To give you an idea of how my technical eyes move, here’s what stands out to me:
- Price is below the 50 day moving average (caution)
- Price is still above the short-term uptrend line from November to present (important near-term support)
- Price is resting just above a confluence of support (around $765): uptrend line, 38.2% Fibonacci retracement, and the October closing highs – this area also aligns with a measured A-B-C move lower. (very important near-term support)
It is the last point that is the most important from a near-term technical perspective. If the stock can hold above $765, it will remain constructive for a bounce, or perhaps more. Keep an eye on the Relative Strength Index (RSI), as it is currently at 38.50. Note that a drop down near 30 often leads to a trading bounce. However, I prefer an RSI divergence before I enter longer-term swing trades. Trade safe, trade disciplined.
GOOG Stock Near-Term Chart
Twitter: @andrewnyquist and @seeitmarket
No position in any of the mentioned securities at the time of publication.


 Flirting With Critical Support… Again")

