Gold put together a nice rally into the 4th quarter of 2023. But the rally seems to have lost steam and may be ready to roll over.
Today we take a look at a long-term “weekly” chart of the Gold ETF (GLD) to highlight the two main obstacles for Gold.
Overhead Resistance and stumbling momentum.
More on this further below (with the chart).
Note that the following MarketSmith charts are built with Investors Business Daily’s product suite.
I am an Investors Business Daily (IBD) partner and promote the use of their products. The entire platform offers a good mix of tools, education, and technical and fundamental data.
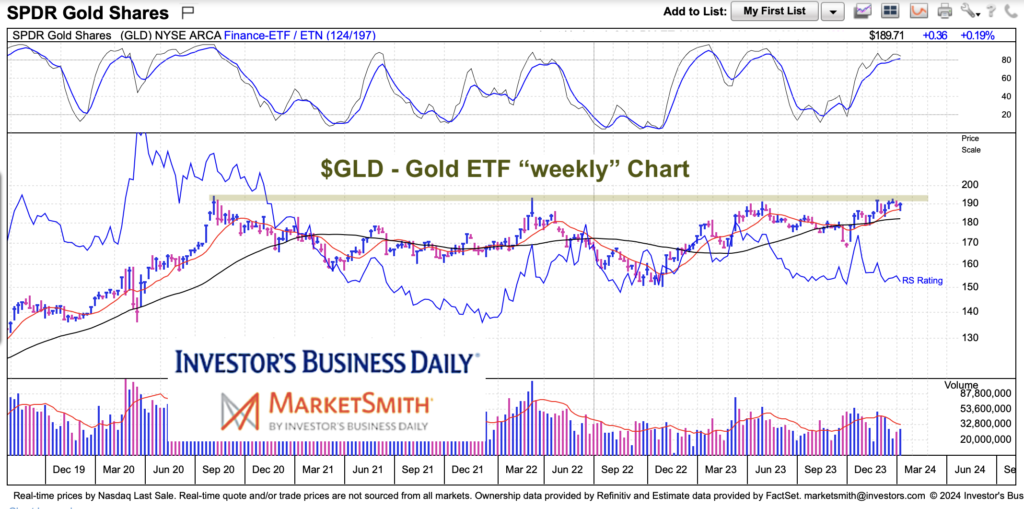
$GLD Gold ETF “weekly” Chart
Here we can see a very long basing pattern following Gold’s peak in 2020 (which was also at resistance). Since then, GLD has tested resistance 3 times (including its recent rally).
So what does this mean? Well, this is very strong resistance. And until it’s decisively broken, patience will be required by gold bulls.
BUT it also means that any breakout will be huge. A 3 year sideways basing pattern should bring an explosive breakout… when/if it occurs.
For now, price looks like it’s losing momentum and should bring another pullback with it.
Twitter: @andrewnyquist
The author may have a position in mentioned securities at the time of publication. Any opinions expressed herein are solely those of the author, and do not in any way represent the views or opinions of any other person or entity.

 Testing Important Price Support")
: Cup (and Maybe Handle) Watch")


