Everyone seems to have an opinion on the direction of interest rates at the moment. I suppose that has been true for the last five years or so. The expectation of rising rates simply because the 10 Year U.S. Treasury Note yield (TNX) is low relative to historical norms has been argued by many. Nobody really knows what will happen, but we are about to witness what has become a rather controversial technical event – a Golden Cross on the 10 year yield.
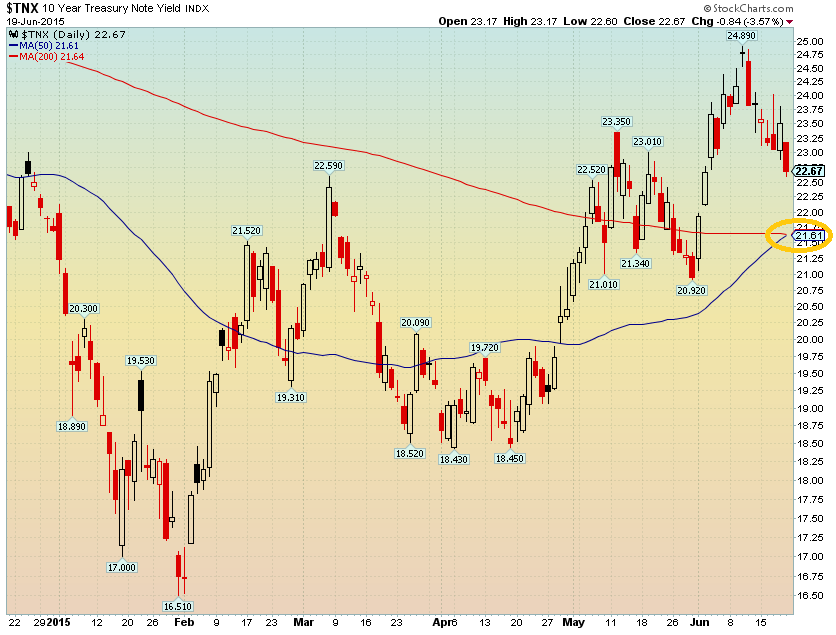
A Golden Cross is when the 50 period moving average crosses above the 200 period moving average. Traditional thinking is that a Golden Cross is a bullish sign as it means short-term bullish momentum is breaking the longer-term bearish trend. Of course, this bullish crossover would theoretically be bearish for Treasury note prices. The imminent Golden Cross is circled on the 6-month chart below.
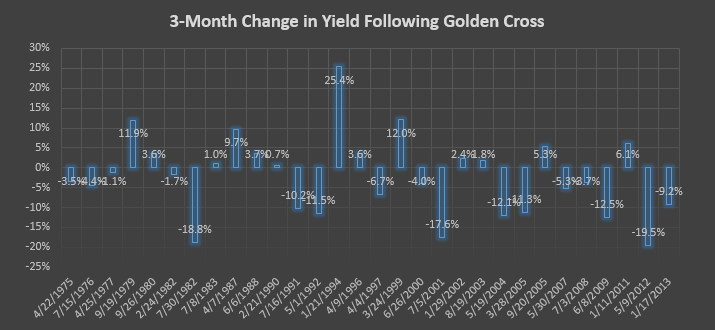
Has the Golden Cross been a good indicator for the 10 year yield? If you look at the last 30 occurrences (30 is a nice statistical number, right?), the results are mediocre at best. The forward 3-month change in the 10 year yield is actually DOWN 2.2%, on average, following a Golden Cross on the daily chart. The median 3-month change on the interest rate is down 2.6%. To clarify, 2.2% down from the current rate of 2.27% would be a yield of 2.22% on the 10 Year US Treasury Note interest rate 3 months from today.
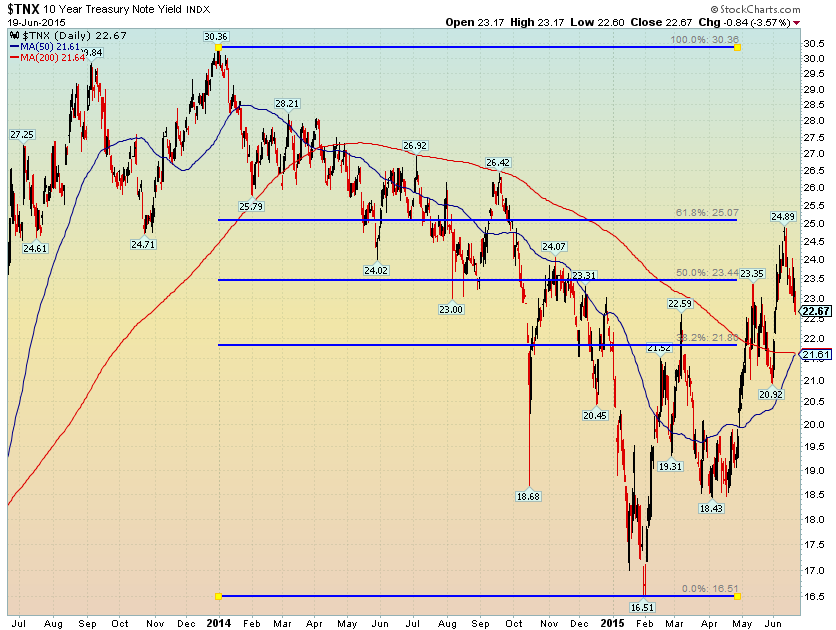
But what does the chart of TNX have to say? The recent spike at 2.49% appears to be a significant resistance point as it is within a couple basis points of the 61.8% Fibonacci retracement level from the 2013 peak to the 2015 low. Also take notice on the 6-month chart above of the dragonfly doji candlestick that occurred at the high – the next day trended lower for the 10 year yield, helping to confirm the indecision and reversal of the prior run up. Perhaps this level is a more important area to watch on the upside versus the Golden Cross.
Thanks for reading.
Twitter: @MikeZaccardi
No position in any of the mentioned securities at the time of publication. Any opinions expressed herein are solely those of the author, and do not in any way represent the views or opinions of any other person or entity.


: Showing Some Signs of Emerging Strength")
