It’s been a heck of a year for precious metals. Through 3 quarters this year, Gold (NYSEARCA:GLD), Silver (NYSEARCA:SLV), and the miners (INDEXNASDAQ:XAU) were big time out-performers.
HOWEVER, those good vibes have been lost on investors during the first few days of trading in October. In short, the precious metals sector has been hit hard in early October.
Today I want to revisit the Gold & Silver Mining Index (XAU) chart. Last month, I warned investors about XAU due to a bearish rising wedge chart pattern. And as you can see in the chart below, XAU has fallen out of that pattern.
Two other variables that also spelled trouble for the Gold & Silver mining index were: 1) The rally retraced 61.8% of the prior decline. This usually is a strong Fibonacci resistance level – see point 1. And 2) The Relative Momentum Index for XAU was peaking at the same time (point 2).
Gold & Silver Mining Index (XAU) Chart
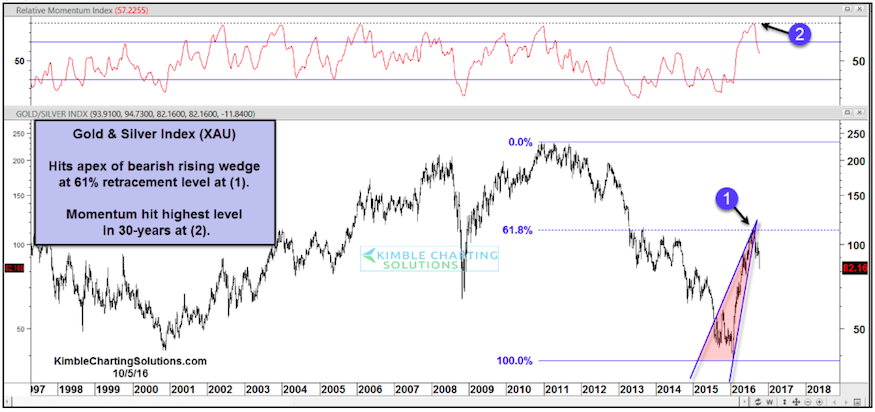
The steeper the rising wedge, the faster the decline. Patience is a virtue in trading – and precious metals will likely need some time before finding their footing. Thanks for reading.
Twitter: @KimbleCharting
The author may have positions in related securities at the time of publication. Any opinions expressed herein are solely those of the author, and do not in any way represent the views or opinions of any other person or entity.


