In late April, I wrote a piece of research on Gold and its prospects for a short-term rally.
That was a short-term analysis that hinged on Gold’s breakout over its downtrend line. It did just that.
Here’s an excerpt (note Gold = $GLD ETF) – Gold prices are in a near-term downtrend. There’s a “very short-term” trading wedge that, if broken to the upside, would be constructive (see chart). There’s also a slightly wider lens short-term wedge that has $118 as support and $123 as resistance.
It took GLD a few more weeks of back and forth within the falling wedge, but eventually Gold surged over resistance. This brings us to today and the prospects for a wider lens, longer-term breakout…
Note that the following MarketSmith charts are built with Investors Business Daily’s product suite.
I am an Investors Business Daily (IBD) partner and promote the use of their products. The entire platform offers a good mix of technical and fundamental data and education.
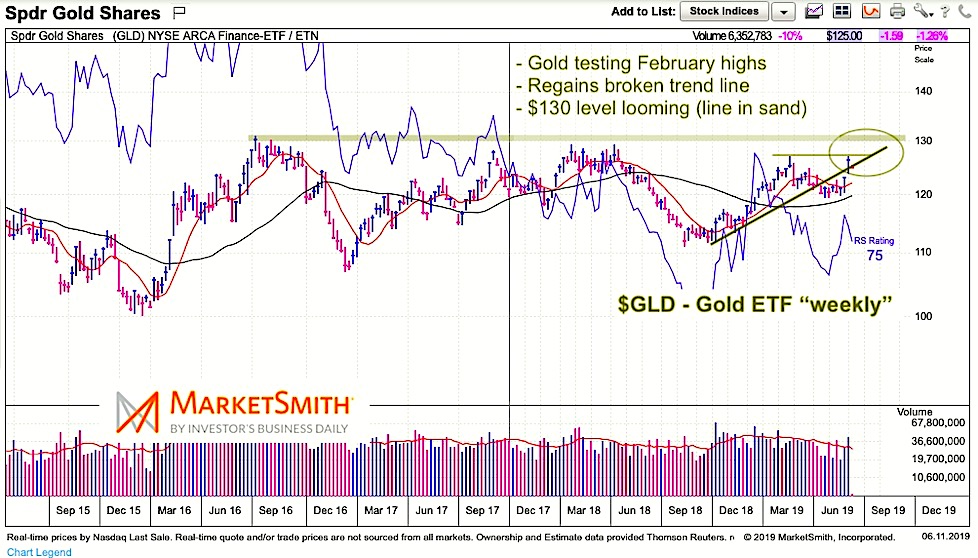
$GLD Gold “weekly” Chart
Gold (GLD) recently surged up to test the February highs around $127. That is now our short-term resistance. Should GLD trade over $127, then the BIG level of $130 comes into play.
That is the battle that everyone wants to see. It’s the bull-bear line in the sand – a 3 year price resistance line. This is the equivalent of $1375 Gold futures. If we get there… it will be important to watch.
Twitter: @andrewnyquist
The author has a position in mentioned securities at the time of publication. Any opinions expressed herein are solely those of the author, and do not in any way represent the views or opinions of any other person or entity.

: Cup (and Maybe Handle) Watch")
 Trading Near Top Of Price Range")

