Since mounting an impressive rally in August, the Gold ETF (GLD) has continued to slide, shedding nearly 8%.
It hasn’t been pretty for precious metals bulls.
Much has been written about the technical weakness in the GLD charts across a variety of timeframes. The break of ascending trend lines in most of the precious metals charts makes GLD a seemingly poor long candidate at this point.
But there’s more to the story, especially for traders with opportunistic time frames.
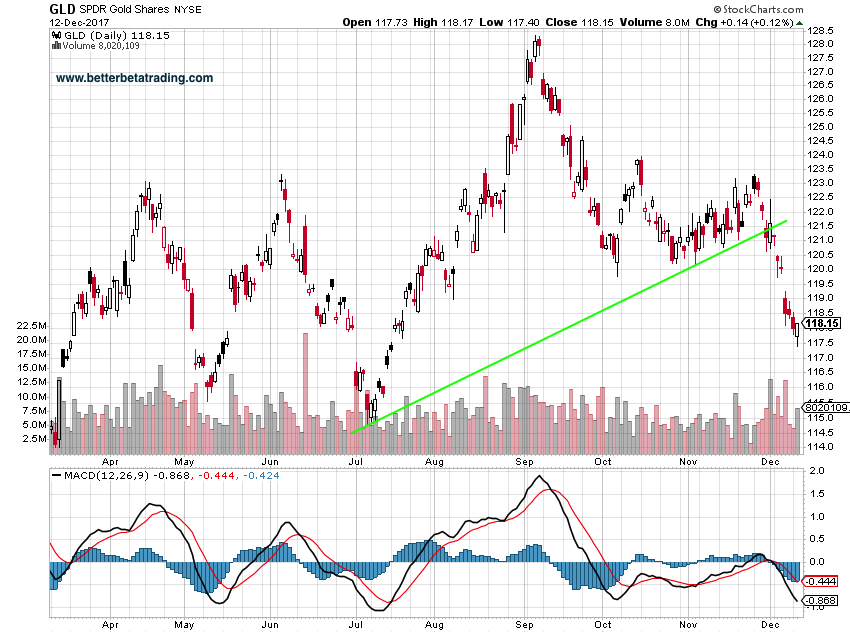
First, let’s look at the daily chart for gold. Here you can see the recent trend line break.
For those traders who still want GLD exposure, seasonality may be a helpful timing mechanism to get in.
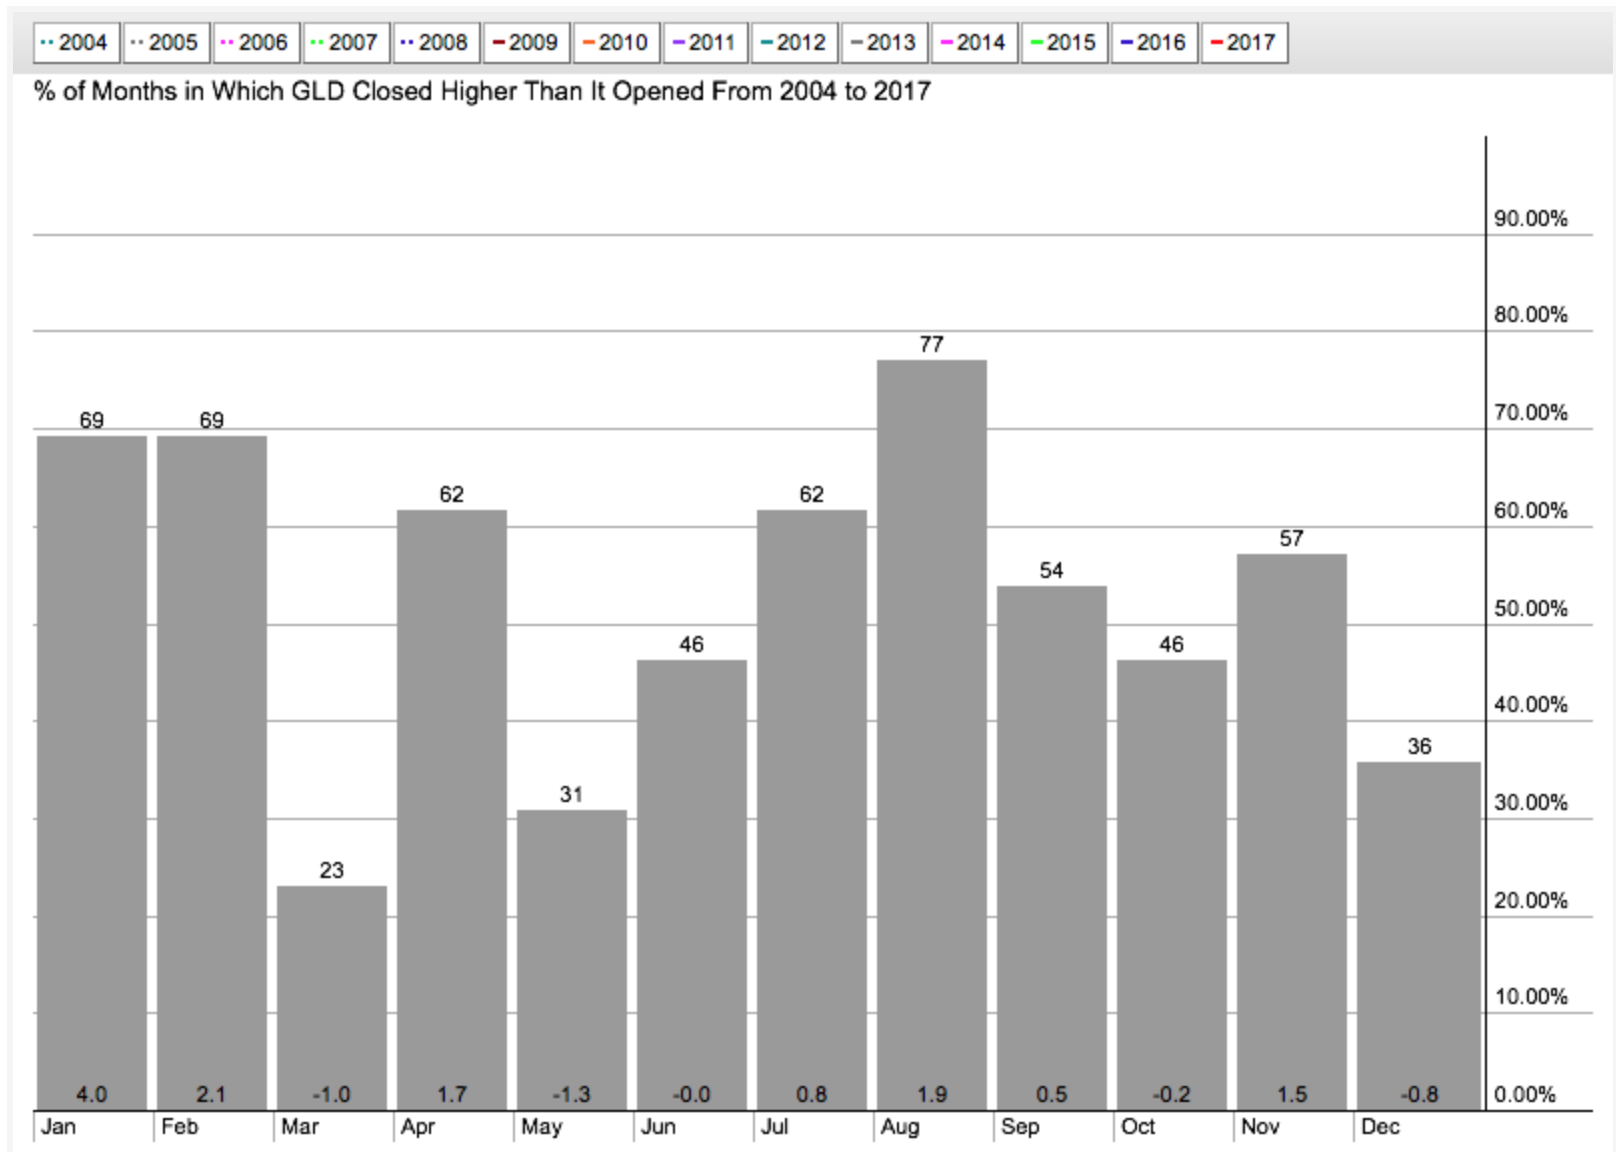
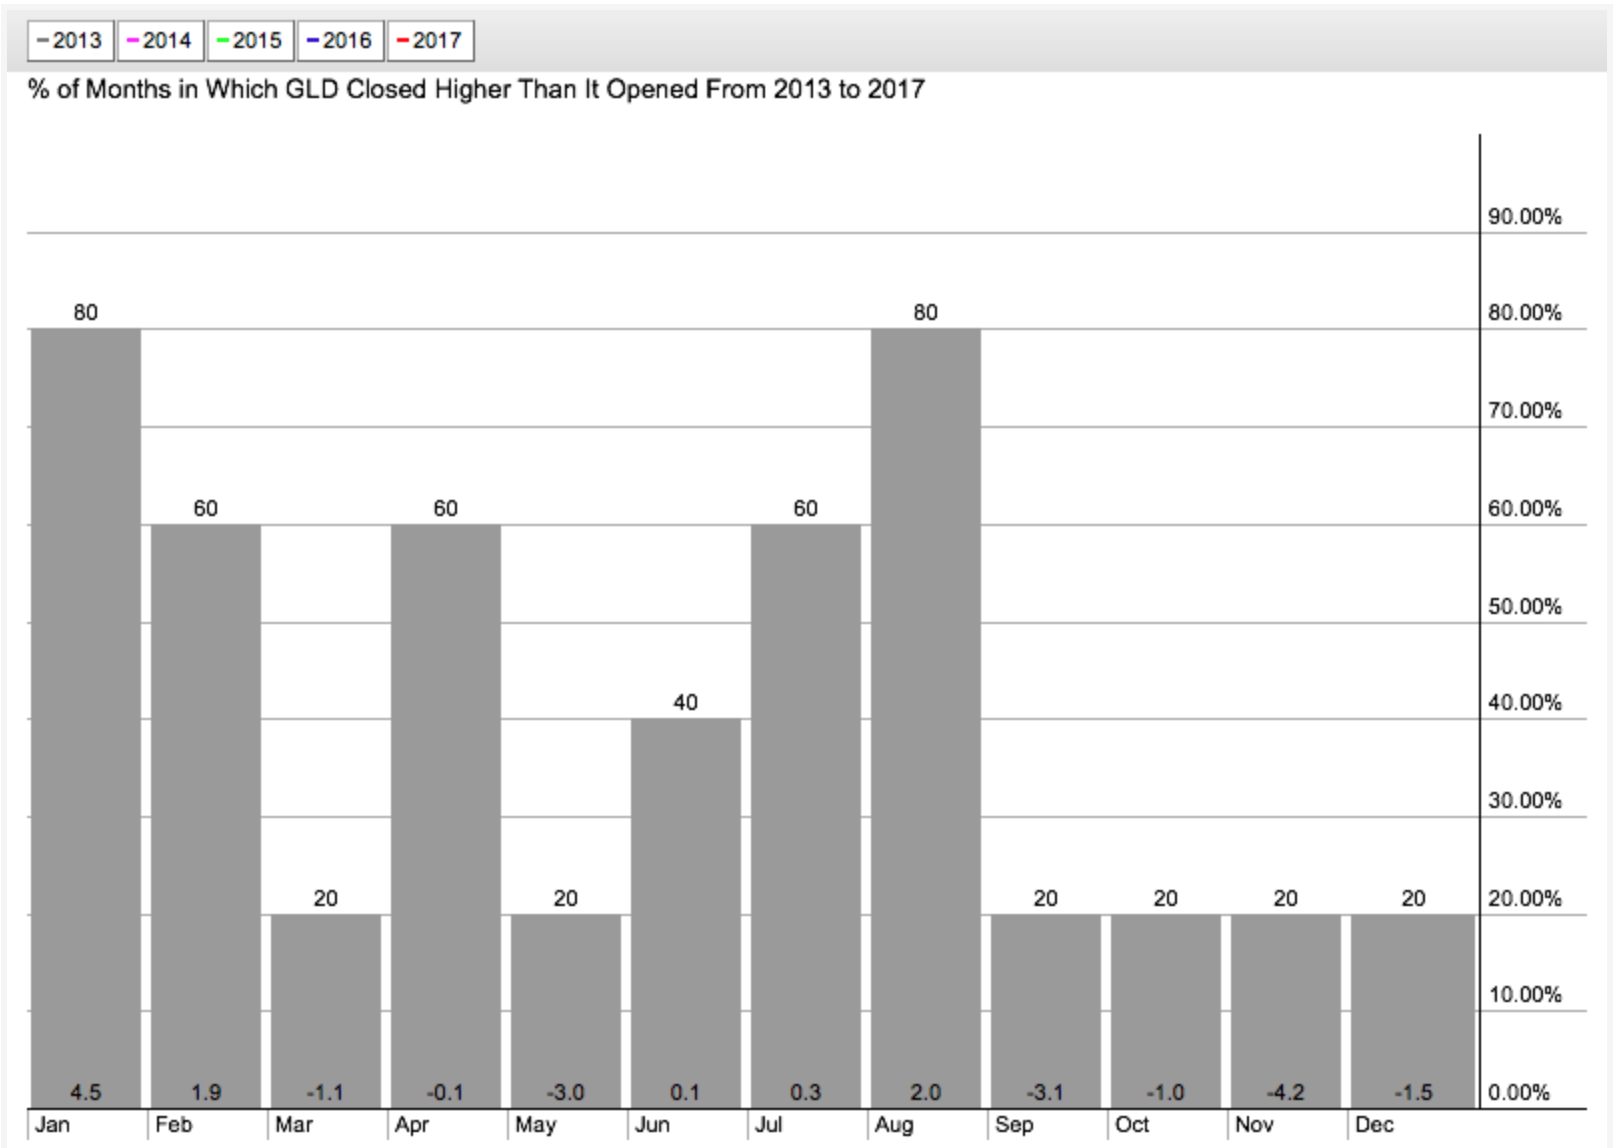
As an article on Bloomberg earlier this week noted, gold has demonstrated distinct seasonal tendencies. Looking back over the past 5-14 years, GLD has massively outperformed during the months of January, February and August (and July to a lesser extent). On the other end of the performance table would be March, May and December, which have seen negative average returns.
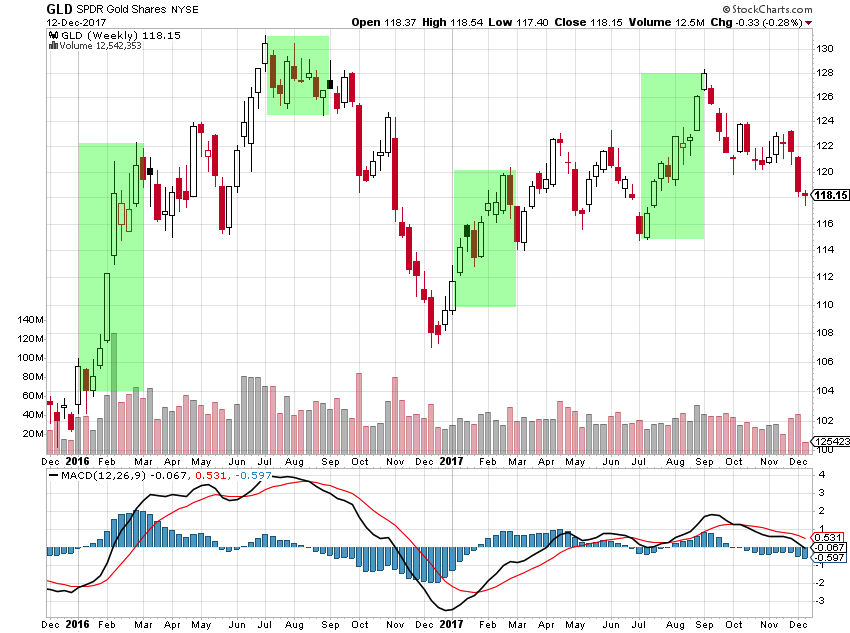
The weekly GLD chart below shows the historically outperforming months in green. While numerous reasons have been given for gold’s seasonality, ranging from Asian holiday traditions to yield curve correlations, it appears to be a self-fulfilling cycle worthy of further examination by traders.
Thanks for reading!
The author may hold positions in mentioned securities. Any opinions expressed herein are solely those of the author, and do not in any way represent the views or opinions of any other person or entity.

 Testing Important Price Support")
: Cup (and Maybe Handle) Watch")

