It’s been a long 5 years for gold bulls. Since peaking in 2011, Gold prices have remained in a downtrend.
The downtrend has seen a series of lower highs and lower lows develop. But Gold bulls (and the market) have stood up and taken notice of the 2016 rally in gold prices. But will a gold rising wedge pattern spoil the bulls dreams of a new bull market?
The latest rally in gold prices is attempting to break the intermediate trend of lower highs and open the door for more upside. But that could be derailed near-term by a bearish rising wedge pattern that has formed over the past 6 months. Probability suggests that 2 out of 3 times this pattern sees lower prices ahead.
For this to actually occur, though, the support at point (1) needs to be broken (see chart below). If support fails to hold, I think selling pressure will increase.
Looking at intermarket relationships, it’s important to note that the US Dollar Index pattern is forming a near opposite pattern (bullish). And so both bear watching.
Let’s look at the bullish side of things: If the gold rising wedge pattern fails to restrain gold prices AND gold is able to rise above major resistance (red and blue lines), then the case for an end to the 5 year bear market will build.
Gold Futures – Weekly Chart
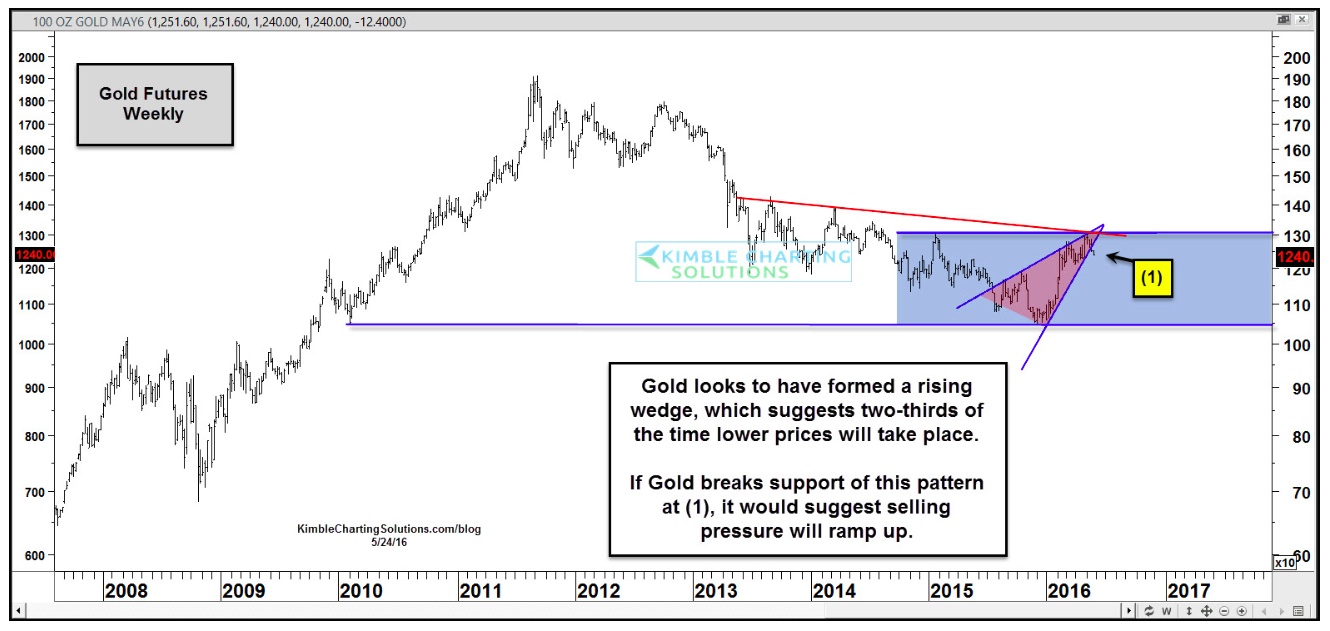
What happens at point (1) in the chart above is very important for gold traders, in my opinion. We will either see support break down or a breakout to new highs. And this will likely send an important message to Gold followers.
Good luck out there and thanks for reading.
Twitter: @KimbleCharting
The author does not have a position in related securities at the time of publication. Any opinions expressed herein are solely those of the author, and do not in any way represent the views or opinions of any other person or entity.

 Rolling Over At Key Fibonacci Level?")


