Sometimes gold glitters, sometimes it fades.
It’s been that way for the past few years of trading, as gold prices have been caught in a wide range.
What gold bulls really want is to turn back the clock a decade and experience the euphoria all over again. But that type of environment doesn’t come along all that often.
That said, Gold may be offering an opportunity for upside in the months ahead for the patient.
Today we will take a quick technical outlook for Gold over the intermediate term. I will highlight a few things that will tell us if Gold will remain in a soggy range… or if Gold is ready to breakout!
Note that the following MarketSmith charts are built with Investors Business Daily’s product suite. I am an Investors Business Daily (IBD) partner and promote the use of their products. The entire platform offers a good mix of technical and fundamental data and education.
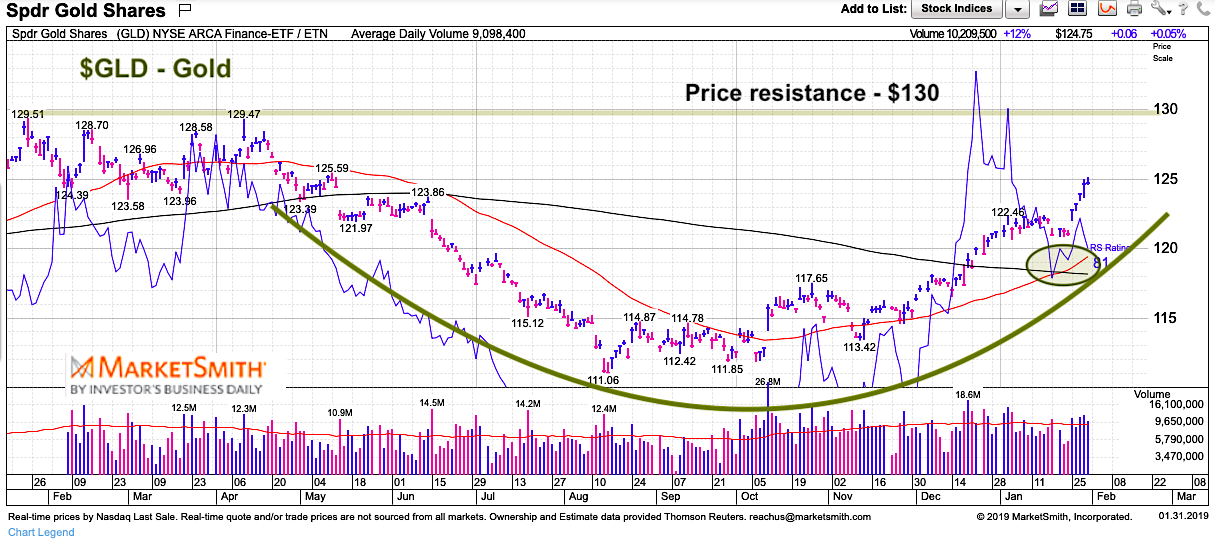
Gold Outlook – $GLD Daily Chart
The daily chart for the Gold ETF (GLD) is about $5 away from major resistance. The $130 price area has foiled a few rally attempts in the last 3 years so what happens here will be important.
So what will make this attempt different? Look no further than the bullish rounded cup-like base that has formed over the past 9 months. As well, the 50 day MA is crossing up through the 200 day MA.
One potential scenario to watch for is a move up to $130-$135, followed by pullback, then a rally again… and finally breakout. Either way, patience – and a plan – are required for interested market participants.
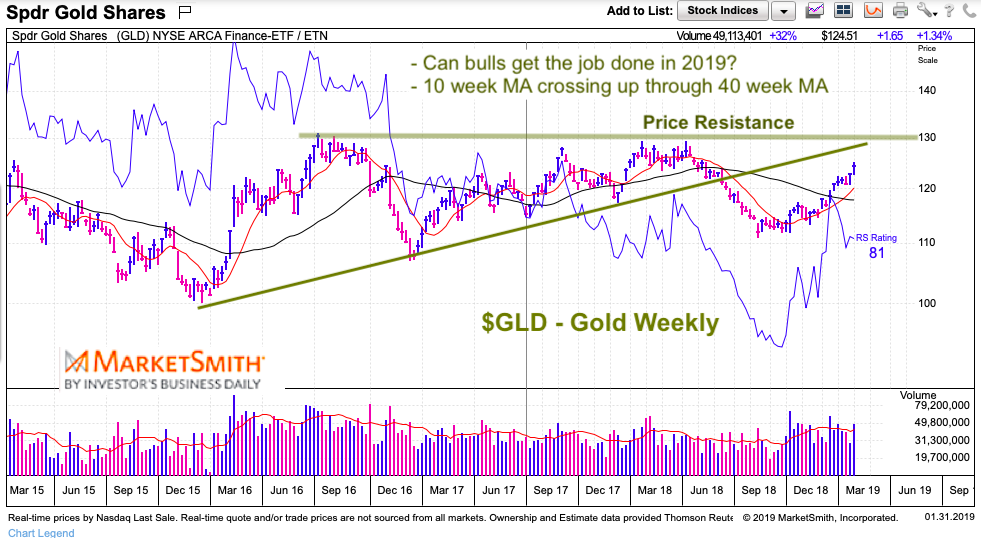
Gold Outlook – $GLD Weekly Chart
The weekly chart tells a similar tale. The $130-$133 level is very important – this is marked by horizontal resistance and the old uptrend line from 2015-2017. Only a strong move that takes out this price level will change the broader trend to bullish.
Bulls have got to like that the 10 week MA is crossing up through the 40 week.
Right now we are building a base, but remain inside a wide range. Know your timeframe.
Twitter: @andrewnyquist
The author does not have a position in mentioned securities at the time of publication. Any opinions expressed herein are solely those of the author, and do not in any way represent the views or opinions of any other person or entity.


