Over the past few years, we have written several articles about the potential “cup” pattern on gold.
And now gold has formed a “handle”. This is a very bullish pattern… provided gold bulls see the breakout!
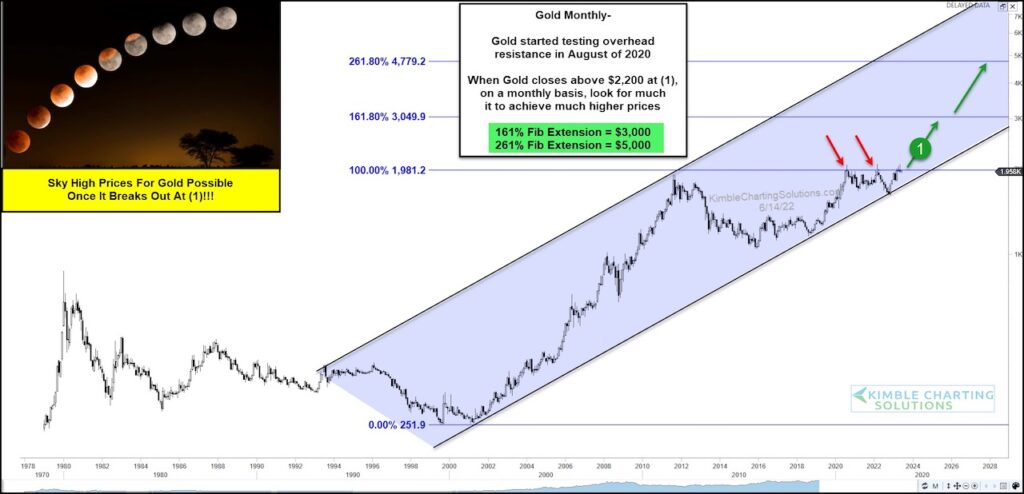
Below is a long-term “monthly” chart that highlights the “cup with handle” pattern for gold.
The top of the cup is being tested for the third time within the handle at (1).
When gold breaks out over $2,200 on a monthly basis, it will be super bullish. Using Fibonacci extensions we see that higher gold price targets lie at $3,000 (1.618 Fib) and nearly $5,000 (2.618 Fib).
So gold could see much higher prices when it breaks out at (1). Stay tuned!
Gold Futures “monthly” Price Chart
Note that KimbleCharting is offering a 2 week Free trial to See It Market readers. Just send me an email to services@kimblechartingsolutions.com for details to get set up.
Twitter: @KimbleCharting
Any opinions expressed herein are solely those of the author, and do not in any way represent the views or opinions of any other person or entity.

: Worrisome to Broader Market?")
