For the past 5 years, Gold prices have traded sideways.
There were plenty of “trades” to be made, but that type of price action tends to grind out long-term bulls and bears.
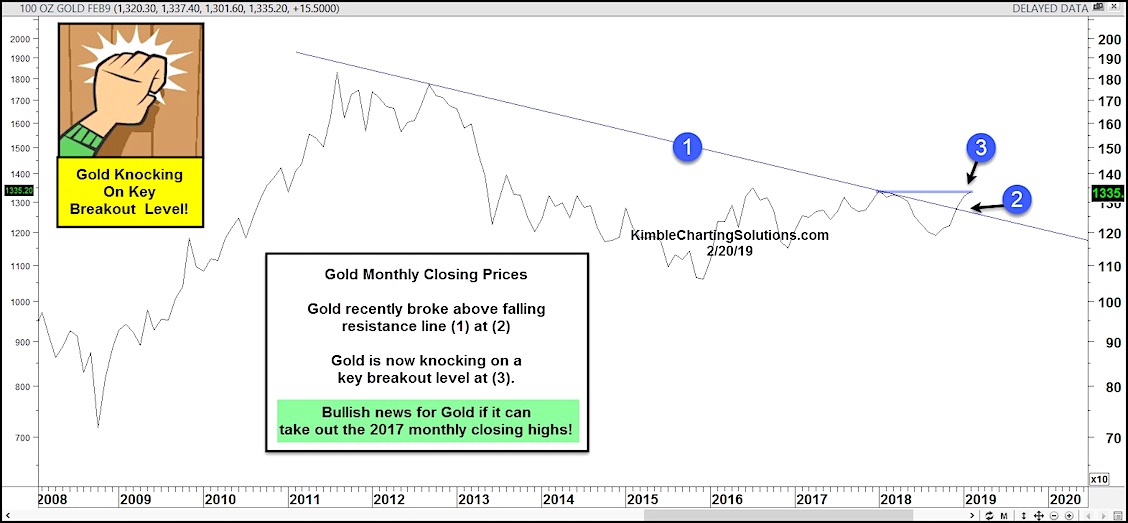
You can see this in today’s “monthly” closing chart for Gold (shown below).
Gold bulls caught a break recently when Gold broke out above its multi-year downtrend line at (1) and (2). This spurred a big advance in metals & mining stocks.
Can Gold bugs and bulls keep the momentum going? We should find out shortly.
Gold is currently knocking on a key breakout resistance level (3). A bullish message will be sent to bulls if Gold can breakout above the 2017 monthly closing highs!
Gold “monthly” Closing Line Chart
Note that KimbleCharting is offering a 2 week Free trial to See It Market readers. Just send me an email to services@kimblechartingsolutions.com for details to get set up.
Twitter: @KimbleCharting
Any opinions expressed herein are solely those of the author, and do not in any way represent the views or opinions of any other person or entity.


: Showing Some Signs of Emerging Strength")
