I have been bullish gold for most of this year. But even a bullish trend has swing “buys” and “sells”.
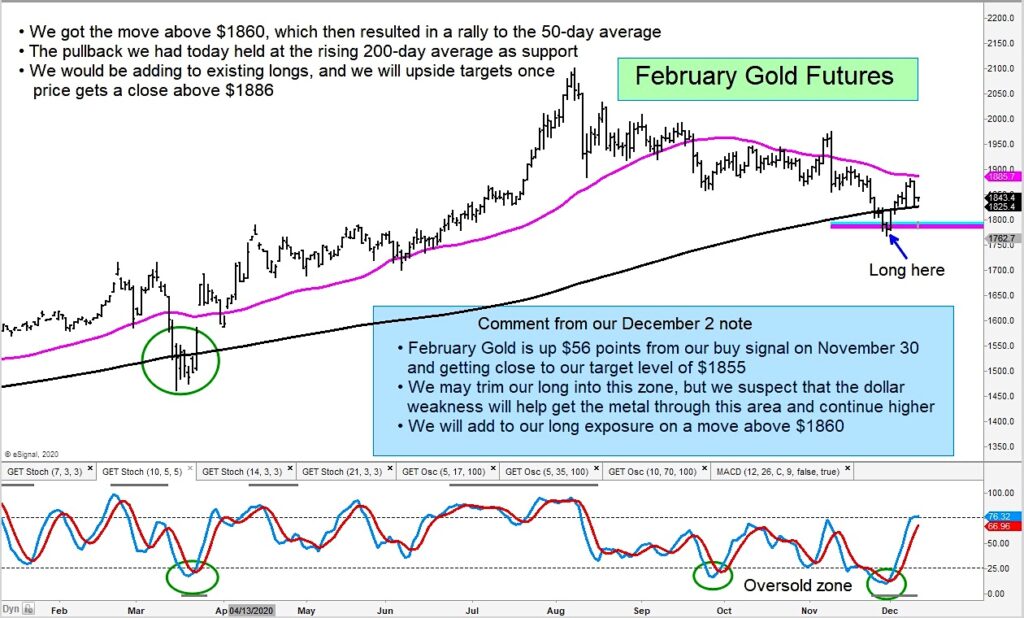
In today’s chart, we can see that gold futures pulled back from our initial +$1860 target zone. That pullback tested and held the 200-day moving average. This area looks like a good risk / reward area for reversal higher.
A move over $1886 would be constructive and produce new upside targets; I will share those price targets should this occur. Gold is volatile so all traders should use stops (and have a plan).
The author may have a position in mentioned securities at the time of publication. Any opinions expressed herein are solely those of the author, and do not in any way represent the views or opinions of any other person or entity.


 Flirting With Critical Support… Again")


