Gold remains elevated but is having trouble getting traction with its recent rally attempt.
With a crazy political environment, domestic inflation, and war abroad, one would think that this is an environment ripe for gold to flourish.
It’s trading just off its highs… but it’s failed to breakout on a few occasions. And looking at the intermediate term “weekly” chart, it seems to be in no-man’s land. Not bearish, not bullish. Simply waiting for action. See chart below.
Note that the following MarketSmith charts are built with Investors Business Daily’s product suite.
I am an Investors Business Daily (IBD) partner and promote the use of their products. The entire platform offers a good mix of tools, education, and technical and fundamental data.
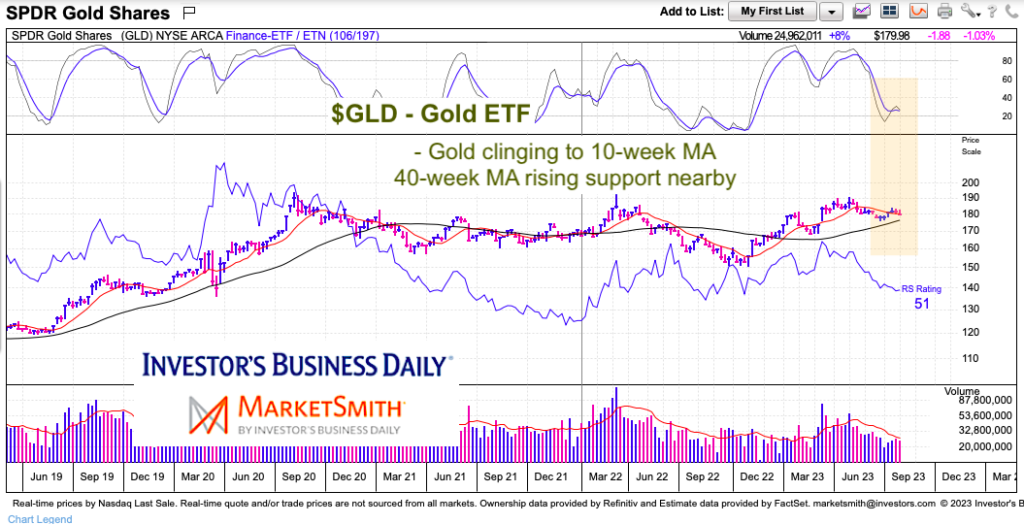
$GLD Gold ETF “weekly” Chart
As you can see, GLD has a non-flashy relative strength rating of 51. That said, it’s 40-week moving average is rising and should act as support. Perhaps they converge as momentum bottoms. This is what gold bulls are hoping for. But for now, GLD is simply trading in neutral no-man’s land on the “weekly” chart.
Twitter: @andrewnyquist
The author may have a position in mentioned securities at the time of publication. Any opinions expressed herein are solely those of the author, and do not in any way represent the views or opinions of any other person or entity.


