In the face of higher yields, higher dollar, gold has been rallying since early March-and really since October 2023 after the trough.
Although there have been periods of consolidation, the move over 2100 sealed the deal.
Huge central bank buying, buyers at Costco, have helped, but the essential question is why has gold been going up all along well ahead of today’s CPI?
I boldly made the call on FOX Bloomberg and other outlets at the start of 2023 that gold would double in price…and while it has not doubled, it has gone parabolic lately. What did I see?
1. Despite some solid economic numbers, there is an underlying rumbling of potential economic chaos-
Rising debt, more and more spending, geopolitical conflicts, supply chain issues, weather concerns.
2. The notion of the FED higher for longer may not be the case as the cost of servicing the Federal debt alone will approach 6% of GDP by year-end. A drop of 150 basis points will reduce the interest payment by 33%. These debt imbalances put the Fed between a rock and a hard place-risk higher inflation or create financial repression by the banks?
3. With bank earnings on tap, assume big banks report well because of the investments in the market increasing capital flow-however regional banks-most vulnerable.
4. Gold is not rallying because of runaway inflation-while CPI is rising it is not anywhere near hyperinflation numbers-so imagine if that happens because the FED reduces rates-and for any reason, the dollar falls?
News today is that a missile strike on Israel by Iran is imminent.
Oil spiked on that news, pushing WTI crude oil over $85 (which is bullish).
Also as expected, gold miners and silver began to move higher.
Silver will move because of industrial demand, but also because it is the poor man’s gold.
Silver outperforming gold is inflationary-we are not seeing that yet.
Miners are moving to meet anticipated demand for gold, silver, and copper-but again-not at inflationary levels-not yet.

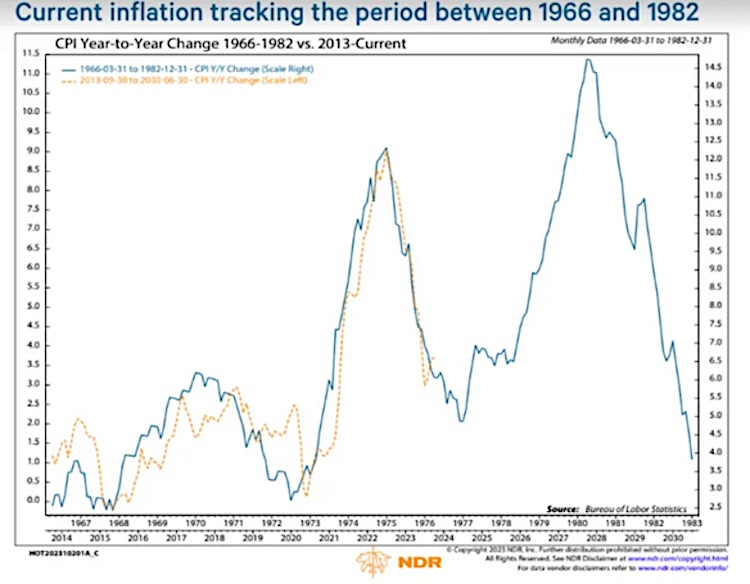
Bottom line: the overlay chart (source: Ned Davis Research) from the 1970s to now is interesting.
A bit too coincidental?
This is not 1979 inflation right now-but imagine if that happens with a FED behind the curve.
We believe that this parabolic run continues for some time-gold will hold 2300 silver 25 and run to 2500-3000 and 35-40 respectively.
But we also believe that when the time comes it has run its course-it will be obvious, and the PMs will go back into hibernation indefinitely.
Twitter: @marketminute
The author may have a position in mentioned securities at the time of publication. Any opinions expressed herein are solely those of the author and do not represent the views or opinions of any other person or entity.


