It’s been a decade of ebb and flow for Gold.
Bulls have seen the best of times (new all-time highs), the worst of times (nearly 50 percent decline), and nearly the best of times again (test of all-time highs)…
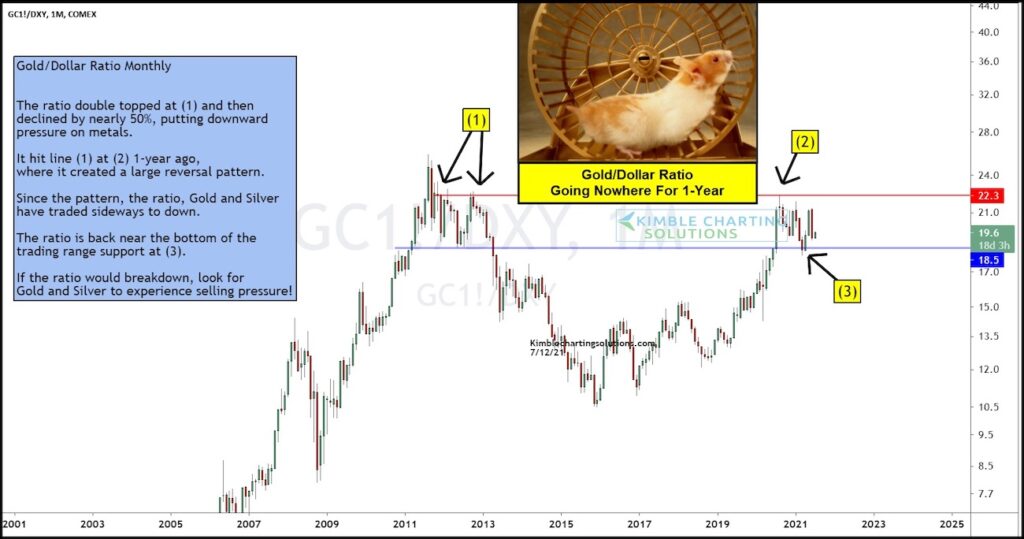
Today’s Gold to US Dollar Ratio “monthly” chart depicts this historic action, while highlighting key reversal patterns and price support/resistance to watch.
As you can see, the Gold to US Dollar ratio double-topped 10 years ago at (1). The ratio stumbled between support and resistance for over a year before confirming the reversal pattern by breaking key price support. When the decline was finally over, the ratio had slid nearly 50 percent!
After building a strong base, the Gold ratio rallied once more and hit line (1) last year where it created a large reversal pattern at (2). The result of that reversal pattern has been sideways to lower trading for the Gold ratio, Gold, and silver. The ratio is currently trading near the bottom of a 1-year price range marked by key support (3).
If buyers don’t emerge at (3), the ratio could be headed for a steeper decline… and this would likely usher in selling pressure for Gold, Silver, and the precious metals sector. Stay tuned!
Gold / US Dollar Index Ratio “monthly” Chart
Note that KimbleCharting is offering a 2 week Free trial to See It Market readers. Just send me an email to services@kimblechartingsolutions.com for details to get set up.
Twitter: @KimbleCharting
Any opinions expressed herein are solely those of the author, and do not in any way represent the views or opinions of any other person or entity.


