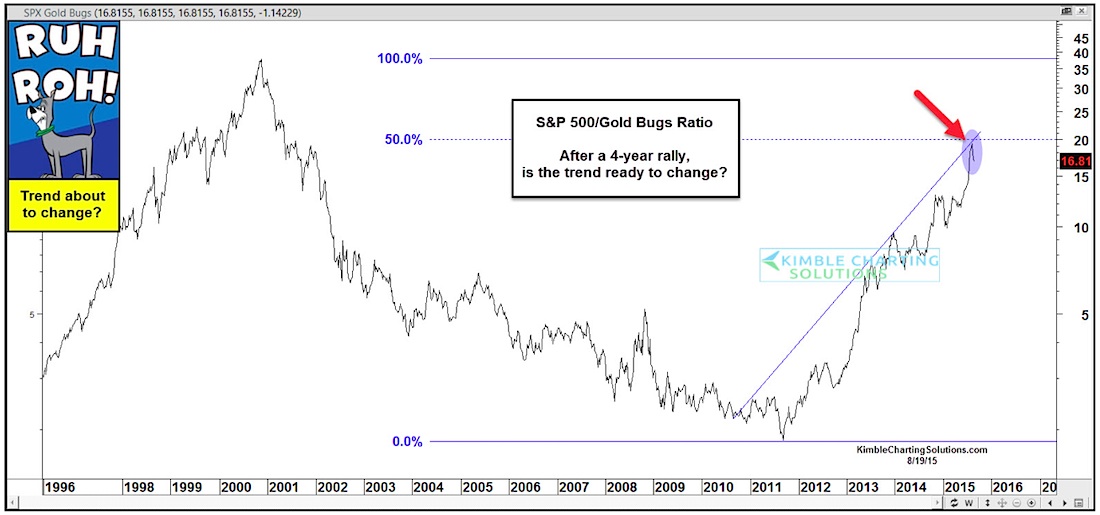
The chart below looks at the S&P 500 to Gold Bugs Index ratio over the past 20 years.
As you can see the ratio trended lower from 2000 to 2011, reflecting that the Gold Bugs Index was stronger than the S&P 500 for over a decade.
But over the past 4 years the opposite has been true, as the S&P 500 has been much stronger than Gold stocks (S&P has done well since 2011 while the Gold Bugs Index has fallen nearly 70%).
Is a change of trend about to take place in this ratio?
Of late the ratio hit the 50% retracement level of the 2000-2011 decline and a steep rising resistance line. At this time one can NOT say the trend has changed, because it hasn’t!
So, what would one look for to see if this trend is truly changing?
I would look for this ratio to break support and if the GLD/SLV ratio and the GDXJ/GDX ratio (shared with my precious metals members) also breaks support at the same time, odds ramp up that a trend change in the hard hit metals complex is occurring.
Thanks for reading.
Twitter: @KimbleCharting
Author does not have a position in any mentioned securities at the time of publication. Any opinions expressed herein are solely those of the author, and do not in any way represent the views or opinions of any other person or entity.


: Showing Some Signs of Emerging Strength")
