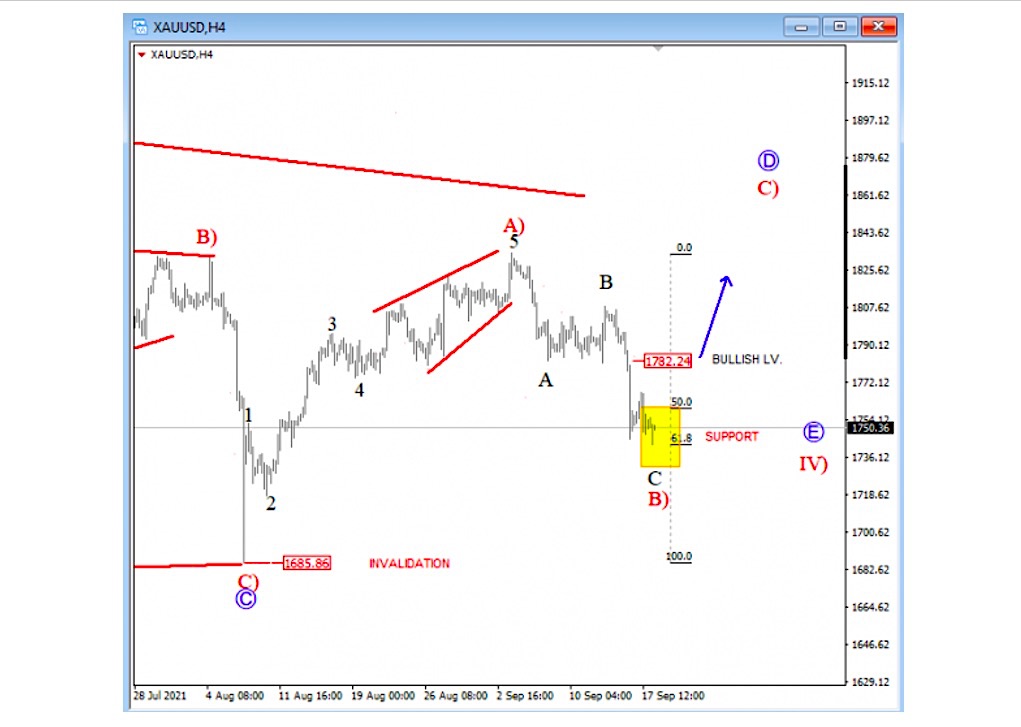
Back in August Gold made nice and impulsive rally away from 1685 lows, as seen on the 4-hour chart that we labeled as first leg A) of a three-wave recovery within higher degree wave D.
So, with current three-wave A-B-C pullback for B), seems like gold may find a base and trading low soon.
Ideally here around 61.8% Fibonacci retracement, which means that we have to expect another recovery within wave C) of D up to 1850 area, especially if price recovers back above 1782 region.
GOLD 4-hour Elliott Wave Analysis Chart
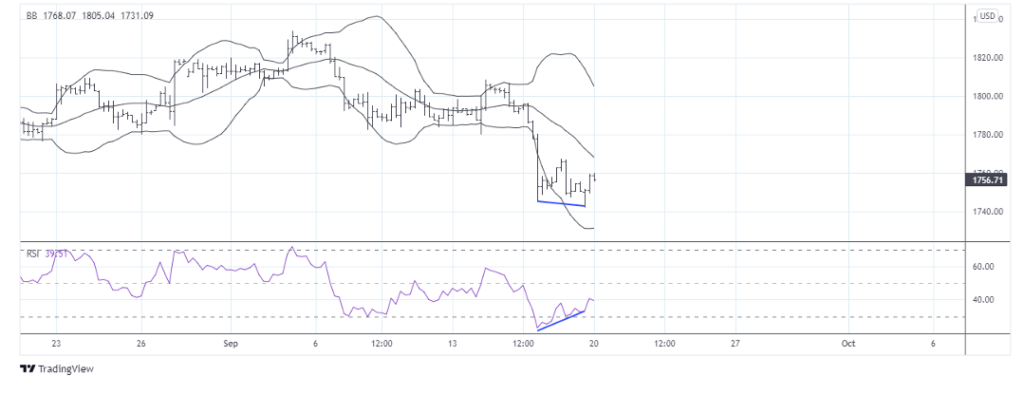
Technically Gold is bouncing from lower Bollinger band and we can we bullish divergence on 4h GOLD chart, seems like Gold searches for the support.
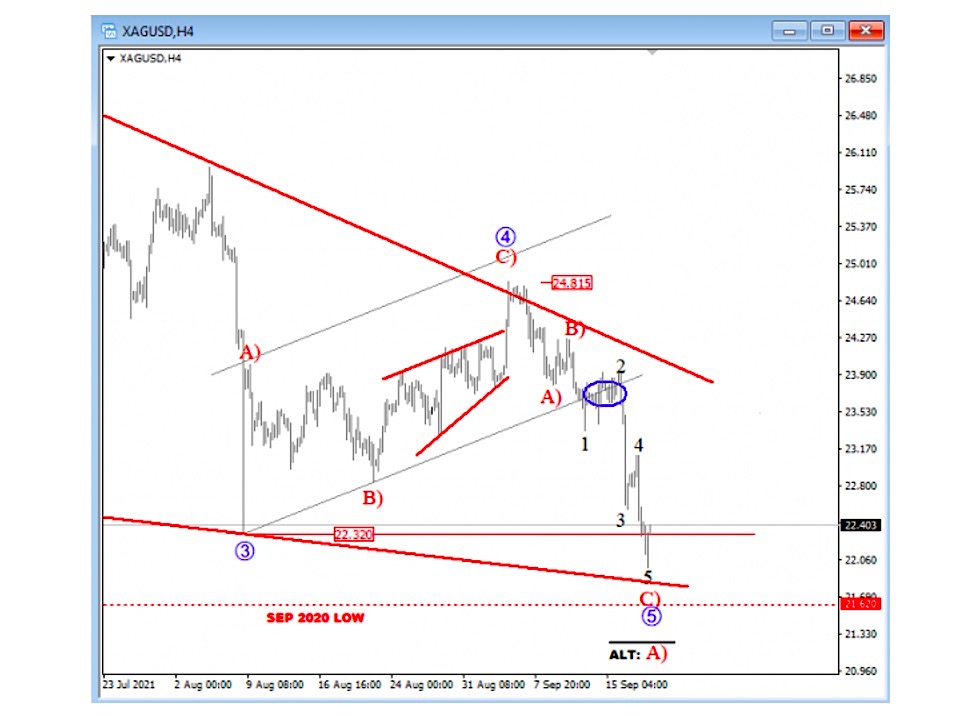
Silver is coming even lower in the 4-hour chart, now breaking even August lows, so we are tracking final wave 5 of a bigger ending diagonal (wedge) pattern that can find the support soon, ideally here in the 22 – 20 zone, but keep in mind that bulls could be back in the game only if we see a recovery back above 24.80 region.
Silver Elliott Wave Analysis
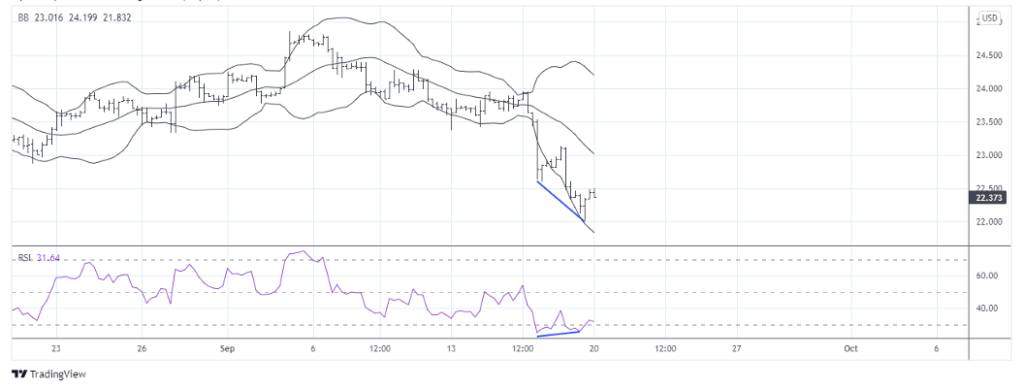
Like Gold, Silver is also forming a bullish divergence on its 4-hour chart. This likely means that support is nearby.
Twitter: @GregaHorvatFX
The authors may have a position in the mentioned securities at the time of publication. Any opinions expressed herein are solely those of the author, and do not in any way represent the views or opinions of any other person or entity.

 Testing Important Price Support")
: Cup (and Maybe Handle) Watch")

