By Korey Bauer Gold has been an interesting topic of late as it continues to be very weak even though central banks globally continue to print money at unprecedented rates. It’s important to note, thought, that Gold has been going down for a multitude of reasons, and I intend to highlight many of those reasons in this Gold analysis and technical update.
Gold Analysis & Overview
China seems to be scaling back on the amount liquidity they are injecting into the system. Inflationary expectations on our Global CPI Index are showing no signs of a pickup in inflation anytime soon, which will be another headwind for gold. And there has also been a lot of chatter coming from the FED that at some point this year they might end asset purchases (QE – Quantitative Easing). Gold investors don’t like the FED or any other Central Banks across the globe taking their feet off the gas which has been the main focus of Gold’s historic run.
Some of the economic data as of late looks to be a little uncertain as well, so only time will tell what the FED will eventually do by the end of 2013. The stock market year-to-date is up over 6% while gold is down over 5.5%. As investors become more comfortable and fear exits the markets, investors could dump their gold and move into equities. A low/falling real interest rates environment has been bullish for gold. On the other hand, high/rising REAL interest rates are bearish for gold. If gold investors are feeling threatened by a sharp rise in real rates, they may be ahead of the game before the yellow stuff takes even more of hit.
BUT, I would also like to point out a couple of reason that gold may bounce soon: 1) the sequester and 2) Italian elections. The upcoming debacle in Washington might be a positive sign for Gold in the short-term. Gold analysis 101 is that investors usually flock to safety (Treasuries, Gold) in times of uncertainty, especially regarding global political and financial issues. It should also be noted that the Italian vote is absolutely crucial to Italy and future of the Eurozone mess.
Technical Update – Gold Analysis
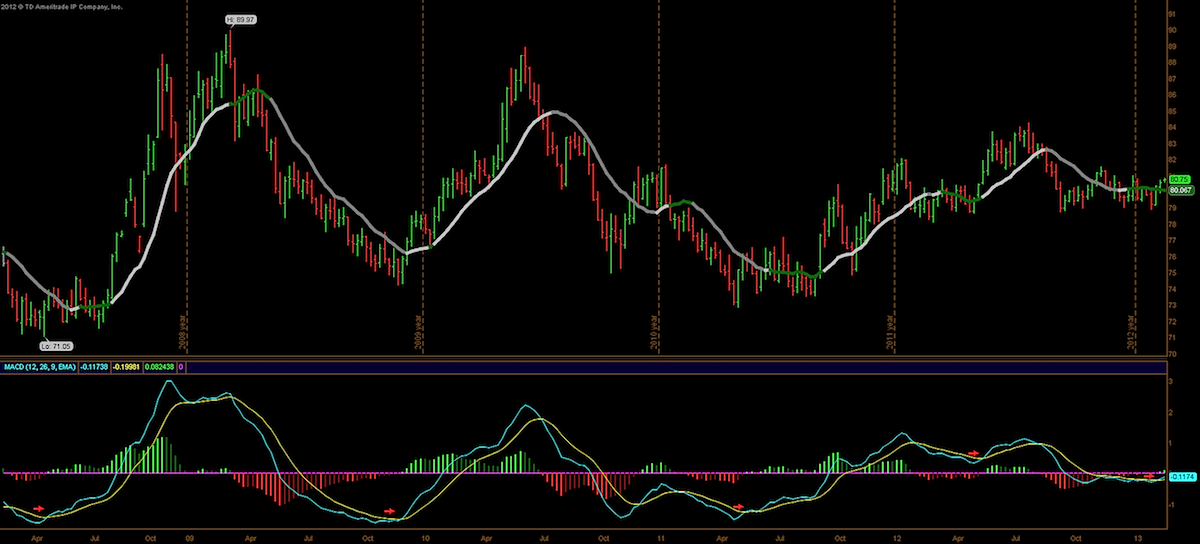
Let’s start with the dollar. The dollar has been very strong as of late and I have been posting for some time about this pending squeeze higher in the dollar. The squeeze indicator gave me a reading a few weeks back that a price expansion was near for the dollar after a long period of contraction. When the MACD was leaning towards positive momentum for the dollar, it added some validation to my thesis on a dollar move to the upside. The dollar move higher may last a few more weeks and may lead to a test of the 84 level. This coming week, I expect the dollar to consolidate a little before continuing its recent uptrend, as it is a little extended in the short-term.
Let’s take a look at the weekly Gold Bugs Index. Anytime the weekly RSI has broken under 30 it has marked a short-term, or possibly longer-term bottom. So it seems reasonable to think we are due for a bounce in gold.
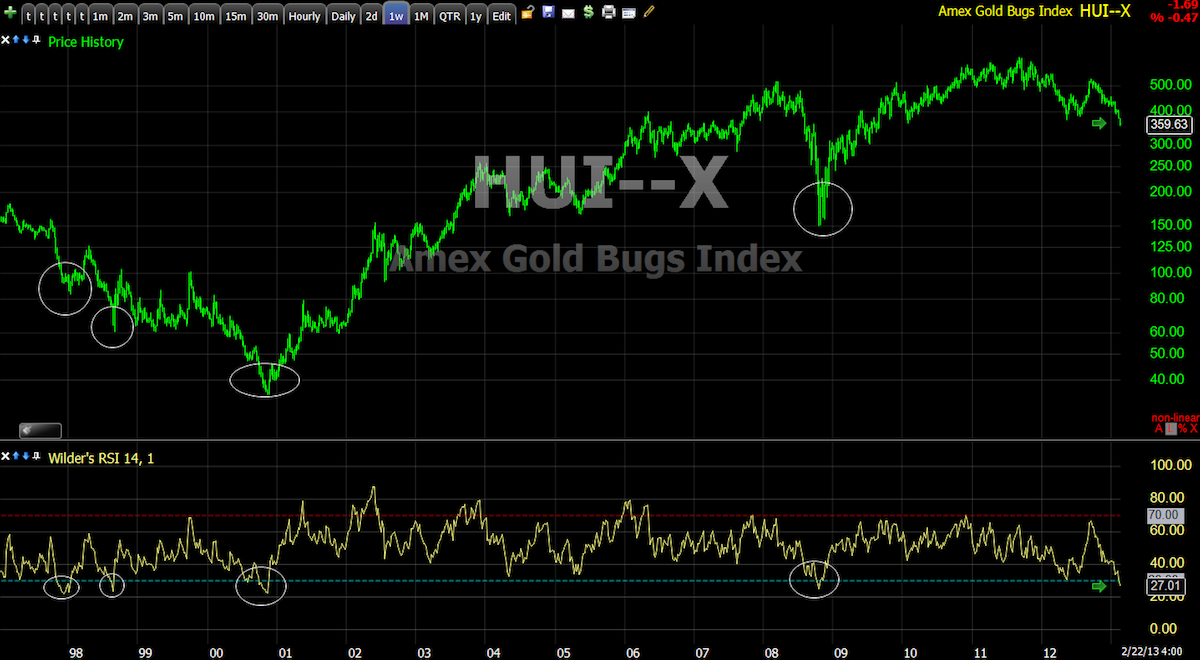
Source: Worden Charts
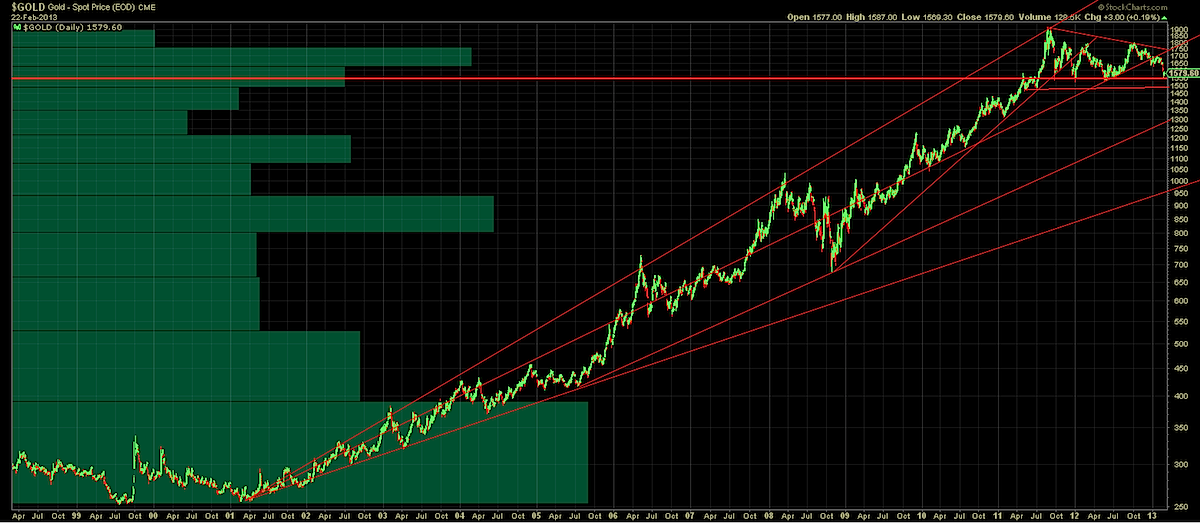
Putting the decline in perspective – A simple gold analysis over the past 15 years shows that gold is up 426%. And since the highs in 2011, Gold is down a little over 20%. I think that puts this overreaction to “the end of gold” in perspective as we continue trade in a range over the past few years.
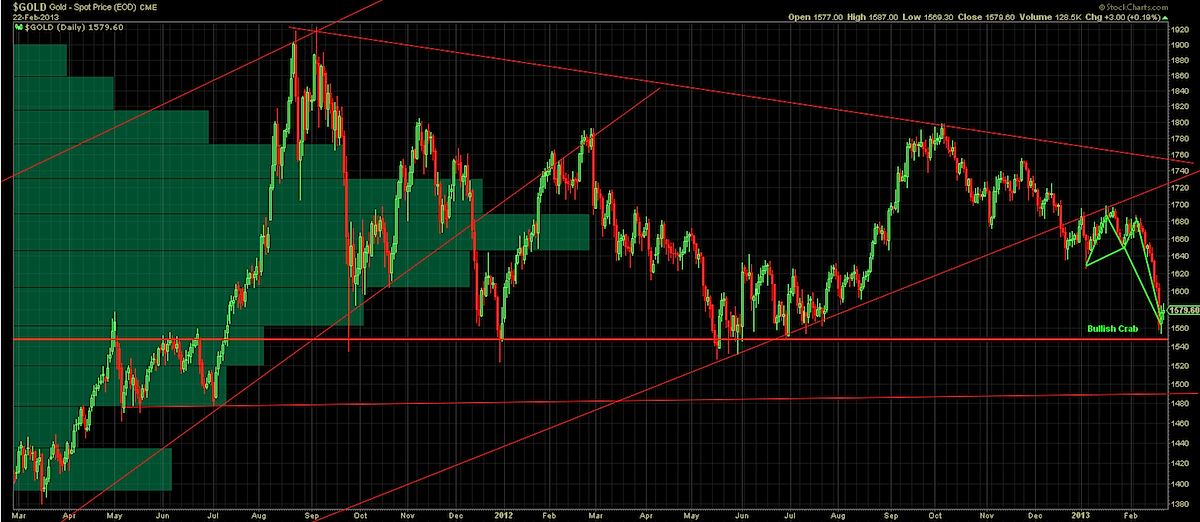
Take a look at the chart below of a little harmonics playing out as well in the gold chart (a bullish crab). As you can see the chart also depicts a 2-year support line that has been key for gold over the last 3 years. 1550 is the key level to watch.
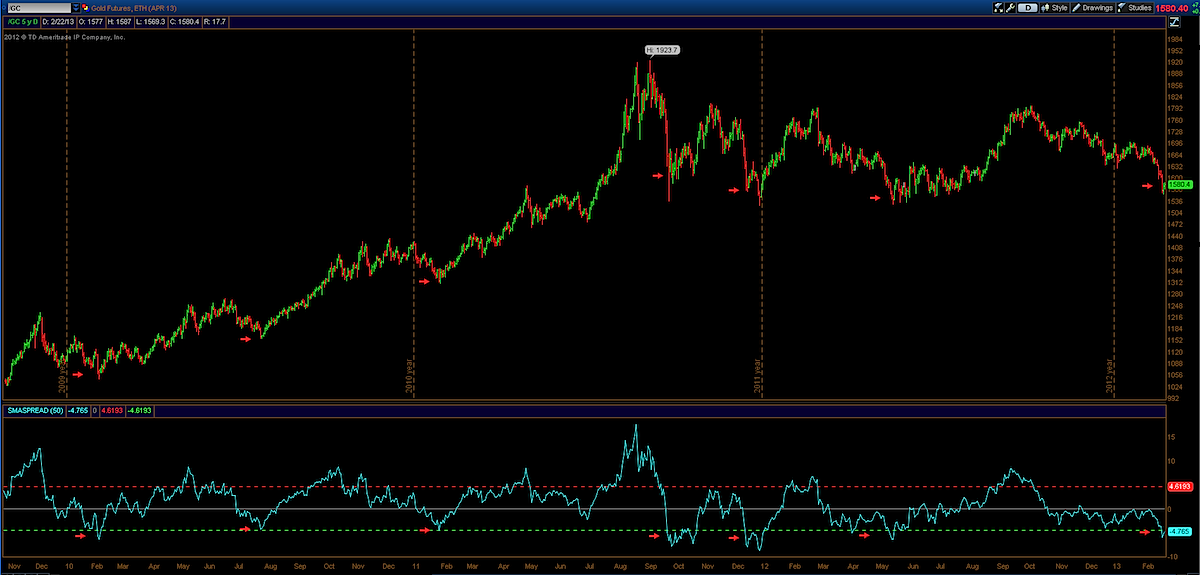
The last chart here gives us an overview of the spread between the 50 day moving and the current price. When the price touches or breaks the lower green line, it represents that price has expanded one standard deviation away from its moving average. This has been a great indicator to use in gold analysis, often marking oversold points in recent history.
Disclaimer: The material provided is for informational and educational purposes only and should not be construed as investment advice. All opinions expressed by the author on this site are subject to change without notice and do not constitute legal, tax or investment advice. At Castle Financial, securities are offered through Cadaret, Grant & Co., Inc. and TD Ameritrade, Inc. Members FINRA/SIPC.
Twitter: @stockpickexpert and @seeitmarket
Author had a long position in Gold at the time of publication.
Any opinions expressed herein are solely those of the author, and do not in any way represent the views or opinions of any other person or entity.


