We’re starting to see hints of a global pullback for the first time all year.
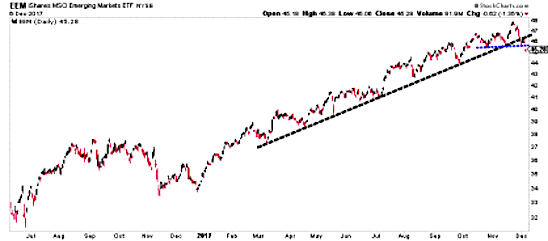
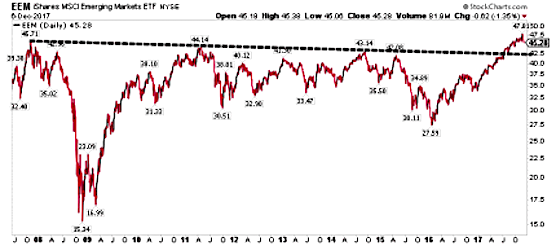
This week, we saw Emerging Markets (NYSEARCA:EEM) make a lower low and confirm a key trend break of the year long uptrend.
Emerging Market ETF (EEM) Chart
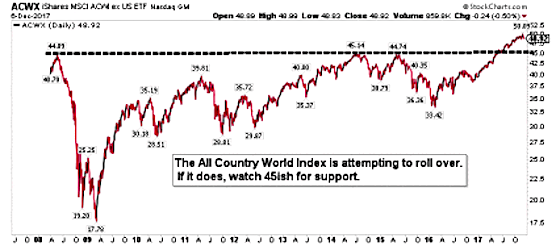
The All Country World Index ex-US (NASDAQ:ACWI) is trying to do the same.
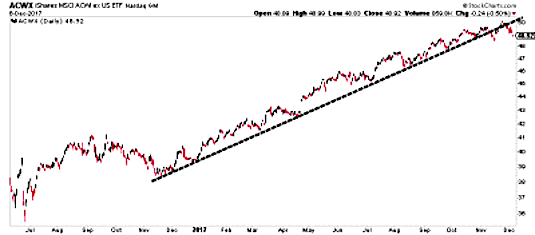
If these breakdowns do lead to lower prices and not sideways action, we have some very easy to define old resistance areas to fall back on. 42-43 in EEM and 44-45 in ACWX.
Breakout Retest? EEM/ACWI Charts…
From these levels drops to those new support areas could give us solid 10-12% pullbacks.
Can you imagine how negative sentiment would get if that were to happen? If we could get that type of reset into such a good risk/reward scenario, that’s our opportunity of the year.
Maybe the market finds its footing soon. But maybe we get there. If we do, you know what I’ll be doing.
Twitter: @ATMcharts
Any opinions expressed herein are solely those of the author and do not in any way represent the views or opinions of any other person or entity.


