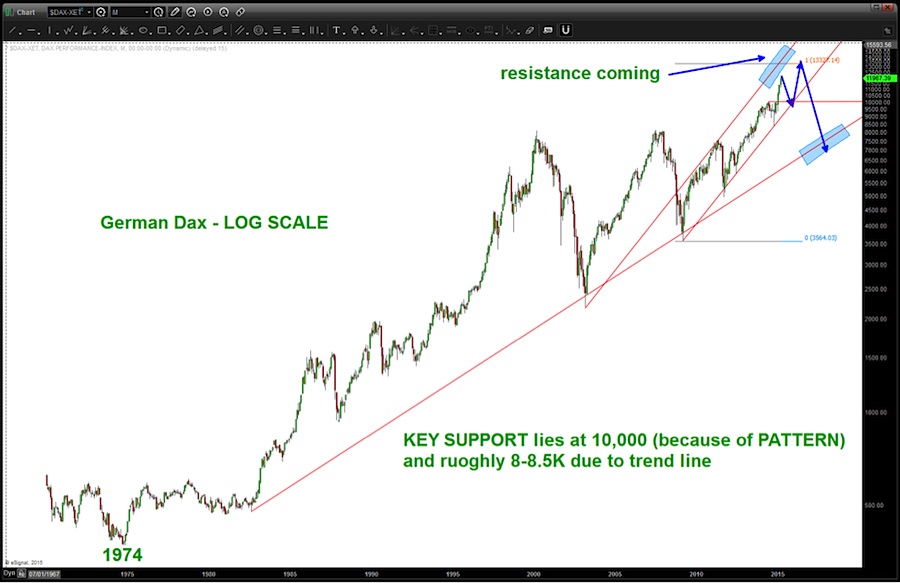
As the German DAX approached 10,000 last year, the PATTERNS at play were very important. The all-all time low in the German DAX was responsible for the PATTERN that was coming into play. So I was not surprised when the DAX dumped over 10% and, quite frankly, I expected the DAX to go lower.
So, in essence, the PATTERN worked but not only did the DAX recover, it exploded thru this long term PATTERN.
The strength of the DAX has been very impressive but the technicals are pointing to a near term pullback and then higher.
Why the pullback and then higher?

As you can see in the monthly chart above, since inception the German DAX has always had bearish divergences present at the pullbacks. We do not have that present at this time… so perhaps a bit higher/sideways before the pullback.
Additionally, the count (if correct) supports a pullback and then another drive higher…
The long-term LOG of the DAX shows the parallel trend lines that have acted at support and resistance since the low in 2003. Pay attention to these areas as they have defined the move quite nicely.
The other thing to watch for is the “Old Sell Pattern” usually will act as strong support. Would not be surprised at all to see the DAX go back down to the pattern level, “kiss it” and then take off to the upside.
Thanks for reading and I hope you all had a wonderful weekend with family and friends.
Follow Bart on Twitter: @BartsCharts
No position in any of the mentioned securities at the time of publication. Any opinions expressed herein are solely those of the author, and do not in any way represent the views or opinions of any other person or entity.


