Today’s “One Chart” features the rising stock price of The Walt Disney Company NYSE: DIS
It’s an interesting chart because of the earnings beat last week and what that means for long-term potential appreciation of Disney’s stock price.
As well, the stock chart for Disney (DIS) illustrates the concept of follow-through, or confirmation.
Looking at the last one year for Disney, as with many stocks it obviously sold off from February down to March.
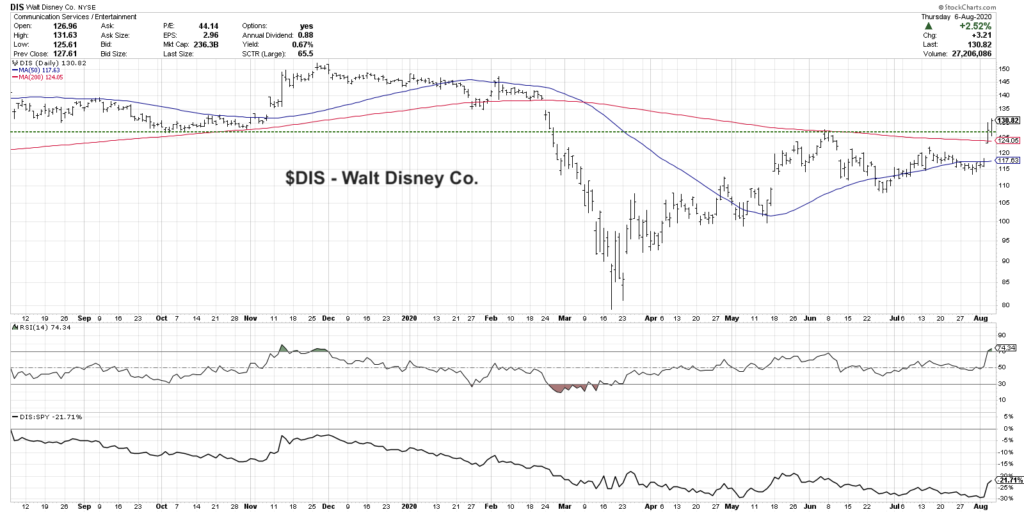
What’s a little different about Disney though is that it actually peaked out last November when the price reached just over $150. It sold off and bottomed out just below $80 in March so almost a 50% drop in the stock altogether.
Since then, from the March to April period, you can see it appreciated back and hit resistance the first week in June along with many US stocks.
What’s compelling here is that peak in June actually lined up really well with the low from last October, which was sort of that last pullback before the final move higher into the November 2019 peak. This is an interesting phenomenon you’ll find a lot in charting where resistance becomes support, or support becomes resistance.
Now what’s happened this week is Disney reported earnings with a surprise to the upside. As a result, the stock gapped up from around $117 to around $123, and from there it rallied and closed above the close from June. Last week’s upswing pushed the stock above its 200-day moving average for the first time since February, since before the market top.
Here’s what’s interesting from a purely technical perspective. It’s now trading above this key resistance level. If it’s able to hold above this level, then that suggests to me a strong potential for a return to the previous highs. An upside to $150 would be a decent up move from here.
What’s also interesting is if and when it would pull back, you would have some clear support levels in mind. To put another way, I think the risk/reward is pretty well-defined. You have potential support at the 200-day moving average which is the upper end of the gap with the earnings win from earlier this week. Essentially you have potential upside to $150, and you could see potential downside to $124 or $125, which would be the 200-day moving average (also the upper end of the price gap).
Further below those levels you could see support around $115 on a deeper sell-off, which is the most recent swing low from late July.
The stock is currently overbought which is pretty common when you’ve had an earnings release and a surprise to the upside. With a gap higher in price the stock becomes overbought, and it’s reasonable to expect a bit of a pullback once the gain is digested. But at this point it has continued to go higher.
Another reason to highlight this chart is the concept of follow-through. I featured this chart on my show on StockChartsTV called The Final Bar yesterday evening, and basically pointed out that the company beat earnings, the stock gapped up, and the stock is now above resistance. But when you have a big move like this, the next day, the follow-through, is quite important.
A lot of times you will find that key levels, for example key resistance levels, key moving averages, etc. will be broken intraday. But the next day, the very next day, it comes back and just reverts back to the previous direction. Anecdotally, you can attribute this to the simple fact that once it has reached that price level, there are no buyers left. There’s just not enough buying power to push the stock higher than that level. It had just enough gas to get to that point and that’s it.
You’ll often find a whipsaw of sorts when a stock hits a key support or resistance level, and I believe a lot of times that’s what perpetuates some of those key levels. People are expecting support and resistance and it can essentially become a self-fulfilling prophecy.
What you want to look for after a big up move is a follow-through day, or what I call a confirmation day. We want a further close, a further move demonstrating that there is more momentum, especially enough momentum to propel this stock to further upside.
In short, after the earnings gap higher last Wednesday, it’s all about the next day. Did we get confirmation of further upside potential? Yes.
Two reasons to review this chart today. First, Disney beat earnings which propelled the stock above the 200-day moving average and above resistance. Even though it’s overbought in the short-term, we should recognize that “overbought means it’s up a lot”. At some point a short-term pullback would be reasonable, but overall, I think this sets the stock up for potential further upside.
The second reason to evaluate this chart today is to describe the concept of follow-though. Once you break a key level of resistance or a key price objective, look for follow-through or confirmation that the initial move has enough momentum to persist. Arguably we’re seeing that positive momentum with Disney.
To watch this in video format, just head over to my YouTube channel!
Twitter: @DKellerCMT
The author does not have a position in mentioned securities at the time of publication. Any opinions expressed herein are solely those of the author, and do not in any way represent the views or opinions of any other person or entity.

: Cup (and Maybe Handle) Watch")
 Trading Near Top Of Price Range")

