I was honored to spend time on Making Money with Charles Payne, Fox Business, and give a brief glimpse into why I am not as bearish right now based on macro economic indicators.
My macro take based on business cycles and zooming out on the charts:
The economic contraction based on longer business cycle timeframe or 6-8 years, might be done.
The 80-month moving average (green line) held in small caps Russell 2000 etf (IWM), the retail etf (XRT), and transportation etf (IYT).
That doesn’t mean we start expanding though.
It just means the market looking forward, might trade to the upper regions of the trading range.
That is the Stagnate part of stagflation.
On the other hand, the business cycle within the longer cycle or 2 years as measured by the 23-month moving average (blue-line) has yet to pierce to the upside except in a couple of sectors like the semiconductors etf (SMH).
So, growth stocks could expand further while the “inside” parts of the US economy remain sideways for longer.
Hence, we have bad news and good news.
The bad news is the indices, and many sectors, are range bound and may remain so for a long time.
The good news is the indices, and many sectors, are range bound and may remain so for a long time.
We still believe that the S&P 500 etf (SPY) could clear over the 23-month moving average.
Ultimately though, the small caps (IWM) must follow.
Two scenarios can spoil the party.
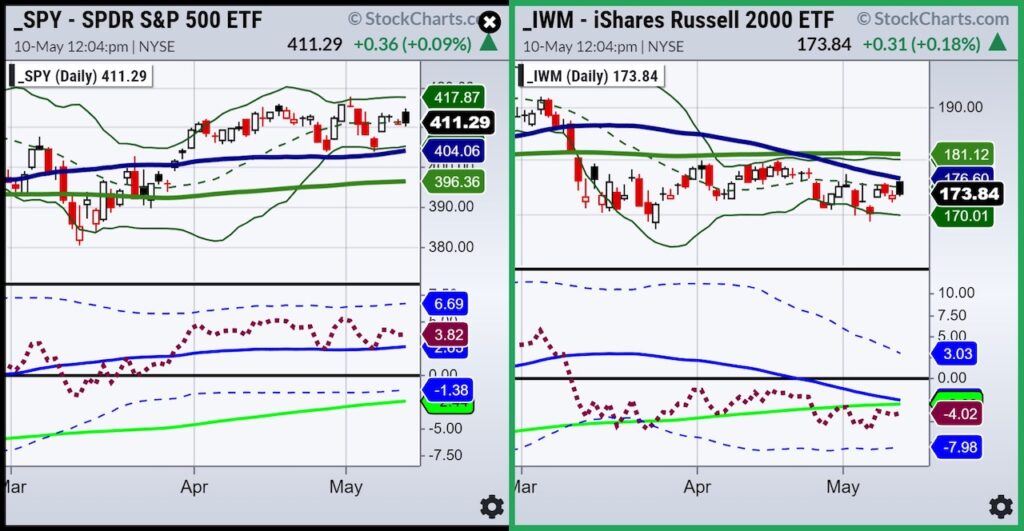
Clearly, you can see the difference between the small caps and the S&P 500 on the daily timeframe as well.
A first step would be for IWM to rally above the 50-DMA or blue line. Then, maybe we are on the way to more upside. Shorter-time frame of course, but a good start if it can happen.
Real Motion Momentum is meh in the SPY and about to enter a bear phase in the IWM. Momentum needs to clear back over both moving averages in IWM to get even more interesting.
More macro:
High grade corporate bonds (LQD) and high yield high debt junk bonds are both in trading ranges.
However, seasonally, and historically, yields tend to peak in May. Considering the CPI numbers, that is possible.
The US Dollar is holding major support, testing the lows of its 2 year business cycle expansion. That is a good line in the sand.
Furthermore, gold and silver are also now range bound- albeit at higher levels. Copper and Platinum are strong. Soft commodities, especially sugar and cocoa, are strong. Food prices remain the stickiest part of inflation.
That is the Flation part of stagflation.
The CPI numbers exclude food and energy. Plus, global inflation still high.
Stock Market ETFs Trading Analysis & Summary:
S&P 500 (SPY) 23-month MA 420
Russell 2000 (IWM) 170 support – 180 resistance
Dow (DIA) Dancing on the 23-month MA
Nasdaq (QQQ) 329 the 23-month MA
Regional banks (KRE) 42 now pivotal resistance-holding last Thurs low
Semiconductors (SMH) 23-month MA at 124
Transportation (IYT) 202-240 biggest range to watch
Biotechnology (IBB) 121-135 range to watch from monthly charts
Retail (XRT) 56-75 trading range to break one way or another
Twitter: @marketminute
The author may have a position in mentioned securities at the time of publication. Any opinions expressed herein are solely those of the author and do not represent the views or opinions of any other person or entity.


