Ford Motor Company NYSE: F reported earnings after-hours on February 4.
Ford reported adjusted EPS of $0.12, which missed consensus estimates of $0.17.
Revenue came in at $39.7B, which narrowly beat consensus estimates of $39.6B. Ford forecasted 2020 annual EPS between $0.94 – $1.20, which was below consensus estimates of $1.31.
This news sent Ford’s stock price down 8% after-hours.
Ford’s CEO, Jim Hackett, noted that the company is at a crossroads as they implement an $11B global restructuring plan. Hackett blamed Ford’s results on poor operational execution.
Ford’s CFO, Tim Stone, suggested that the company’s restructuring plan and product improvements in 2019 and 2020 should set the company up well for a rebound in 2021. Given this background, let’s see what the charts tell us.
Ford Motor (F) Weekly Chart Grid
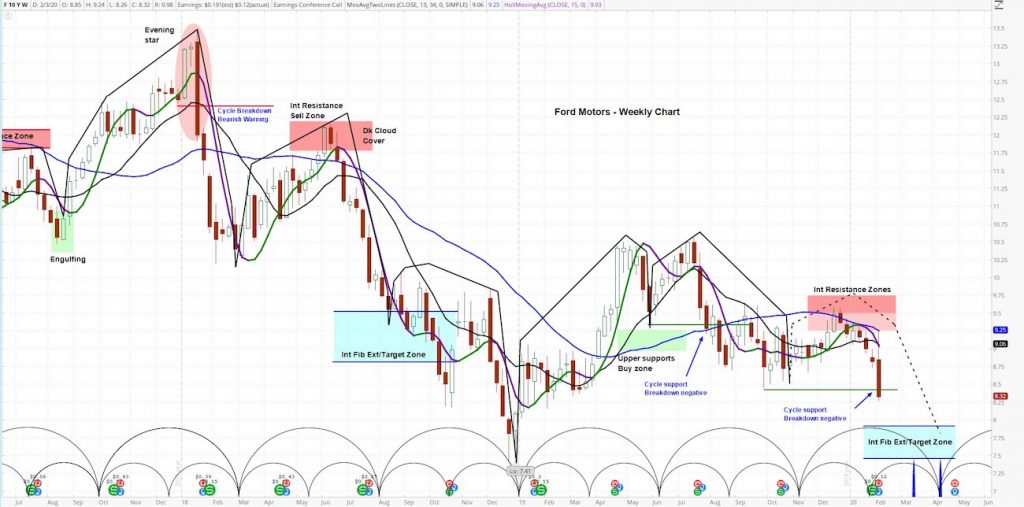
At askSlim.com we use technical analysis to evaluate price charts of stocks, futures, and ETF’s. We use a combination of cycle, trend and momentum chart studies, on multiple timeframes, to present a “sum of the evidence” directional outlook in time and price.
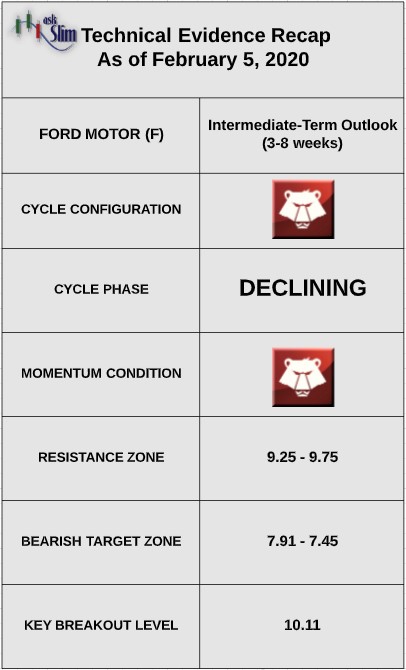
askSlim Technical Briefing: The weekly cycle analysis suggests that Ford is in a very negative pattern. The next projected intermediate-term low is due between the middle of March to the middle of April.
On the upside, there is an intermediate-term Fibonacci resistance zone from 9.25 – 9.75. On the downside, there is an intermediate-term Fibonacci projection/target zone from 7.91 – 7.45. For the bulls to regain control of the intermediate-term, we would likely need to see a weekly close above 10.11.
askSlim Sum of the Evidence: Ford has a negative intermediate-term cycle pattern with negative momentum. Given these conditions, we would expect the stock to trade down to the Fibonacci projection zone beginning at 7.91 by April.
Interested in askSlim?
Get professional grade technical analysis, trader education and trade planning tools at askSlim.com. Write to matt@askslim.com for special askSlim membership trial offers!
Twitter: @askslim
Any opinions expressed herein are solely those of the author, and do not in any way represent the views or opinions of any other person or entity.

: Worrisome to Broader Market?")


