Key Market Takeaways:
European stocks have rallied toward resistance and are on the cusp of breadth thrust of their own. Small-cap (and mid-cap) U.S. stocks are seeing improved relative strength. Copper prices have heated up and gold is approaching significant resistance.
The S&P 500 has continued to recover from the panic selling that emerged in December (which saw nearly half of the issues on the S&P 500 making new 52-week lows on a single day – the most in a decade).
Breadth thrusts and some evidence trend stabilization (of not outright improvement) from U.S. equities has helped obscure some of the improvements seen elsewhere. While emerging markets have shown some leadership and attention, international trends remain generally weaker than those seen in the U.S. Only 15% of the markets in the all-country world indexes have 200-day moving averages that are rising.
Relative to the S&P 500, the Euro STOXX 50 index continues to trend lower (though some stability has emerged in recent months). While the chart shows five years of data, the relative price down-trend stretches back two decades.
On an absolute basis, however, Europe has bounced and is a resistance zone, while momentum is challenging a long-term down-trend.

Beneath the surface there is evidence that the bounce in Europe may be gaining strength. While not yet triggering a breadth thrust signal, the percentage of European stocks trading above their 50-day averages has surged to 86%. The record here is more mixed than the similar signal for U.S. stocks, but clearing the 90% threshold could have bullish implications for European stocks. This may be something to watch at a time when European equities remain out of favor among investors.
There are already some hints that international developed markets generally may be poised to following their emerging market counter parts in gaining strength relative to U.S. equities.
We may also be seeing a leadership rotation among U.S. equities. In last week’s Market Commentary, we discussed recent leadership of the equal-weight S&P 500 versus its cap-weight counterpart. Our Market & Sector Trend Summary piece has shown a shift in sector leadership from defensive areas to more cyclical/economically-sensitive areas of the market.
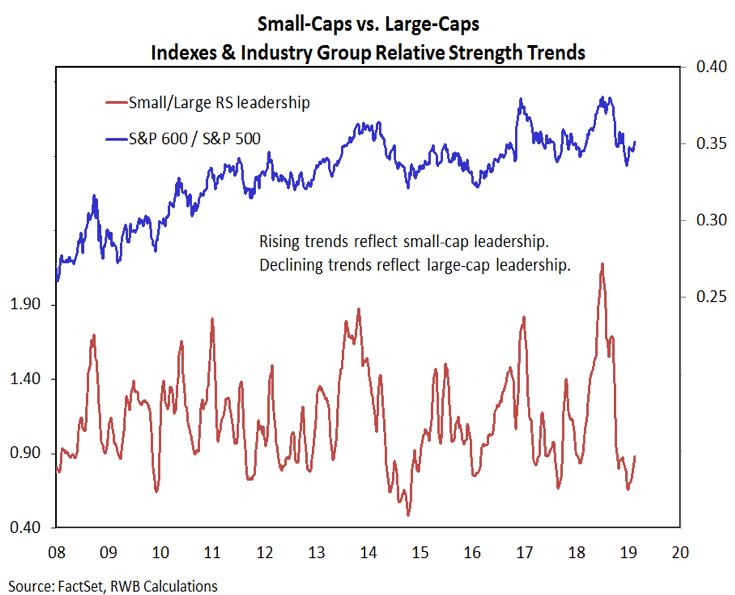
We are also seeing evidence that large-caps may be yielding leadership to small-cap and mid-cap areas of the stock market. Industry group relative strength trends in recent weeks have shown a nascent shift from large-cap leadership toward small-caps.
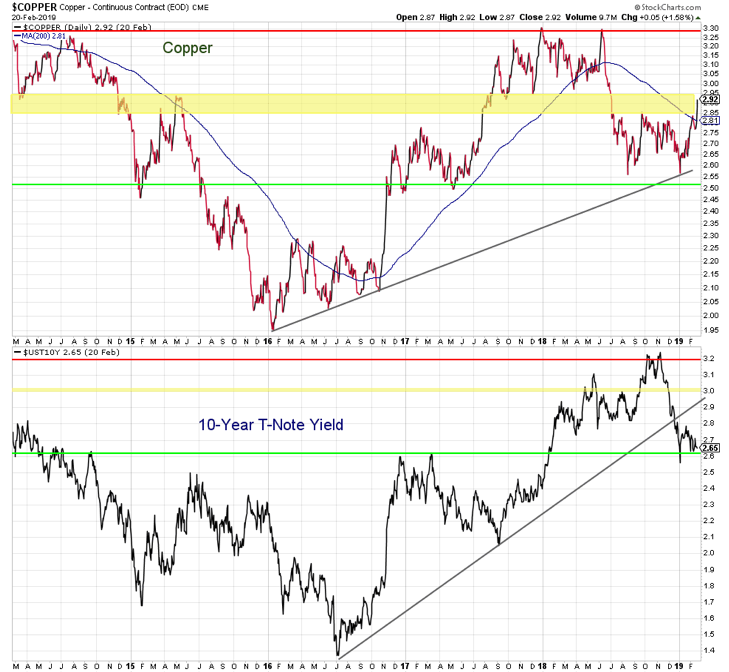
It is not just equities that have seen movement of late. Copper prices have caught a bid in 2019. Copper this week has broken above its 200-day average and is at its highest level since mid-2018. The up-trend off of the 2016 lows provided support at the end of 2016. This could provide support for global equities (the chart on the first page shows European stocks also held support at the trendline off of their 2016 lows).
If improvements in copper suggest an improving global equity and economic backdrop, we might also expect bond yields to be able to move higher.
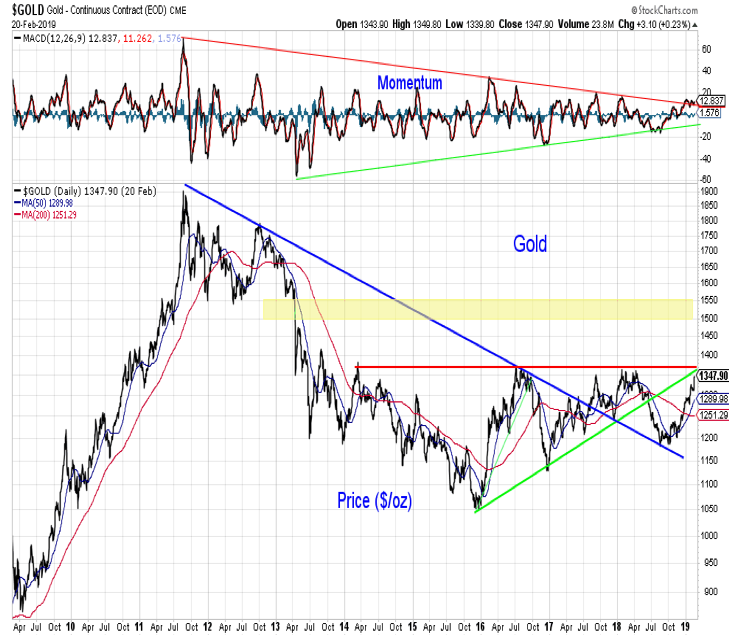
Gold, too, rallied to begin the year, building on strength that emerged in the third quarter of 2018. The 2018 lows for gold came at the extension of the down-trend off of the 2011 peak. Momentum is challenging down-trend resistance while price has moved toward a confluence of heavy resistance near 1365.
Rally attempts in four of the past five years have stalled near where gold currently trades, and with sentiment on gold in the excessive optimism zone, now may not be the time to turn more bullish. If, however, Gold can breakout to the upside (either now or after an optimism-ebbing consolidation), the next level of resistance could be the 1500-1550 zone.
Twitter: @WillieDelwiche
Any opinions expressed herein are solely those of the author, and do not in any way represent the views or opinions of any other person or entity.


