If you’re like most retail swing or position traders, you probably get your signals to open or close a position at the close of the day. You enter your orders overnight and expose yourself to the high variability of the opening price action the next day.
Perhaps we gap down and your order to liquidate a long position is filled at much lower levels than you expected. Or you enter a limit order only to see the market run away from your price, leaving your order unfilled.
Rather than sit and watch the market or attempt to guess where you might be able to open or close a position, why not use an established level to improve your chances of a good fill?
Trading The 3 Day EMA
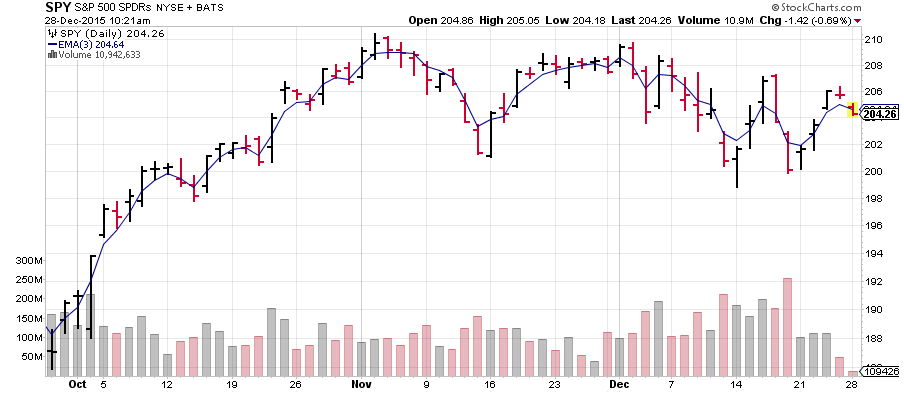
It’s time to consider the benefits of the 3 day exponential moving average (EMA). Check nearly any chart and you’ll notice that the vast majority of days include a visit to the 3 day EMA. Looking at the chart of the SPY ETF over the past three months, you’ll notice that the daily price touched the 3 day EMA 55 times and only failed to touch the EMA in 8 instances. So rather than guess what price you should use to enter your order, you can set your buy or sell price to either match trading the 3 day EMA or set it just above or below it, depending on the market conditions and how quickly you need to get in or out of the position.
How The 3 Day EMA Can Help Your Trading
Closing 100 shares of SPY at 206 rather than 205 can net you an additional $100. While this may not seem like a large amount in percentage terms on a position worth over $20k, it can make a massive difference for options traders. As an example, the difference between 206 and 205 could translate into a 30% swing in the value of your SPY long calls, depending on your strike selection, time to expiration and other factors. Or perhaps you’re closing some credit spreads and looking to squeeze as much premium out of them as possible. By fine-tuning your exits (or getting a more favorable entry) with the 3 day EMA, you are putting one more trading variable on your side.
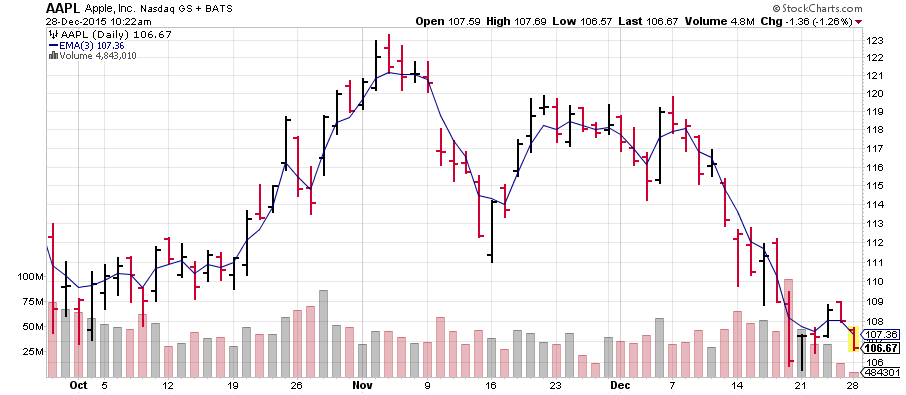
Even single name stocks that typically have large gaps due to events like earnings exhibit the same price tendencies around the 3 day EMA. For instance, the last three months of Apple (APPL) shows only 6 instances of the daily price avoiding the 3 day EMA, even with the significant gap in mid-November. Trading the 3 day EMA can work well to insulate traders from the high volatility of high beta names.
The 3 day EMA is not a magic number but is a great example of how traders of all sizes can use short term indicators to improve their performance and apply some rigor to their approach. Traders can experiment with short EMA’s on weekly charts to manage trades with longer holding periods. Or use a bounce up to the 3 day EMA to initiate shorts or buy puts. However you choose to employ shorter-term technicals, trading the 3 day EMA is an approach that warrants a place in your trading toolbox.
Thanks for reading.
Any opinions expressed herein are solely those of the author, and do not in any way represent the views or opinions of any other person or entity.


