Banking-related stocks have been a forgotten sector for the past 2 years.
But a longer-term sideways basing pattern could set the Financial Sector ETF (XLF) for a move higher.
Today, we look at a “weekly” chart of $XLF and highlight this basing pattern and why the coming weeks should provide insight into whether or not financial stocks are ready to rise.
Note that the following MarketSmith charts are built with Investors Business Daily’s product suite.
I am an Investors Business Daily (IBD) partner and promote the use of their products. The entire platform offers a good mix of tools, education, and technical and fundamental data.
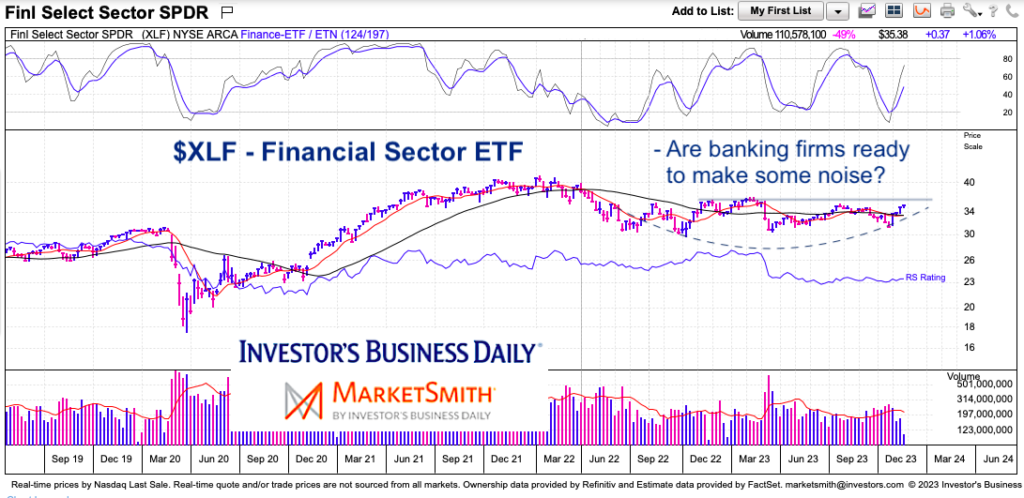
$XLF Financial Sector ETF “weekly” Chart
After falling 25% into 2022, the Financial Sector (XLF) has trading in a sideways basing pattern for 18 months. XLF has put together a recent rally that has it eyeing its early 2023 highs. A move above this level would confirm that XLF is ready to retest its early 2022 highs. However, if XLF turns back down from this level, it will remain boxed in its sideways pattern.
Twitter: @andrewnyquist
The author may have a position in mentioned securities at the time of publication. Any opinions expressed herein are solely those of the author, and do not in any way represent the views or opinions of any other person or entity.

: Showing Some Signs of Emerging Strength")

