Equities markets on Planet Earth got crushed this week, averaging about -4.0% even after Fridays bounce.
That bounce not very convincing as volume was very light. US equites which has been one of the holdouts this year finally gave up the ghost.
The Russell 2000 (NYSEARCA: IWM) barely managed to stay positive on Friday’s bounce and is up just +.75% year to date.
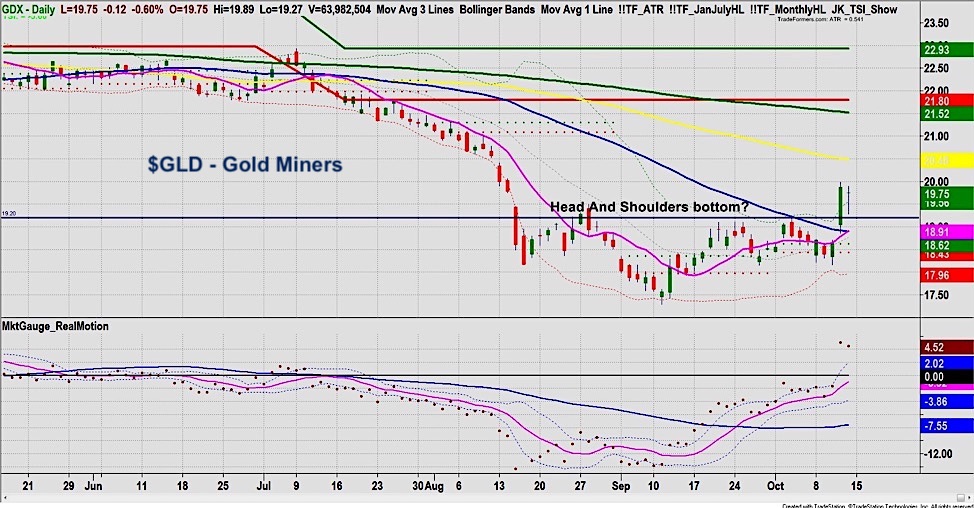
On the other hand, Gold (NYSEARCA: GLD) and Gold Miners (NYSEARCA: GDX) roared on Thursday. And soft commodities defied gravity and put in a positive week.
The uptick in Gold (GLD), strength in commodities and big cap value stocks add credence to the possibility that a long-term top may be in place.
That said, shorter term we have several indicators that show oversold.
Here’s a look at Gold Miners (GDX):
The highlights of this week’s market action are the following:
- Despite Friday’s rally, the S&P 500 (SPY) could not close above the 200 day moving average and the Russell 2000 (IWM) closed beneath the 50 week moving average for the first time since May 2016.
- Volume on Friday’s rally was very weak.
- All members of the Modern Family that represent US economy are underperforming he S&P 500 and eight of the 14 sectors we track are down for the year.
- Gold and Gold Miners (GDX) along with (DBA) soft commodities had the strongest weekly performance across all assets.
- Big Cap Dow stocks and Value stocks continue to outperform Growth.
- Emerging Markets (EEM) have a bullish island bottom pattern.
- Junk debt is still holding relative to US Bonds.
- On Thursday, Sentiment Gauges hit extreme oversold readings.
Considering the short-term oversold condition, we would not be surprised to see a quick bounce that fails and ends up with another test of the recent low or worse. Looking out a bit further, our longer-term quant based Alpha Rotation model locked in some nice gains and issued a sell on October 4 for the S&P 500 and the NASDQ 100. We await the next signal either to buy bonds or re-enter stocks.
Best Wishes for your Trading.
The author may hold a position in mentioned securities at the time of publication. Any opinions expressed herein are solely those of the author, and do not in any way represent the views or opinions of any other person or entity.


