With last week’s strong economic stats and inflation basically flatlined, many believe there will be a soft landing and no recession.
However, there are stats that say with the yield curve so inverted (most since 1983), recession can and probably will still happen.
Recession can take time to emerge with expectations that it won’t occur until 2024 or 2025.
First though, we still see stagflation.
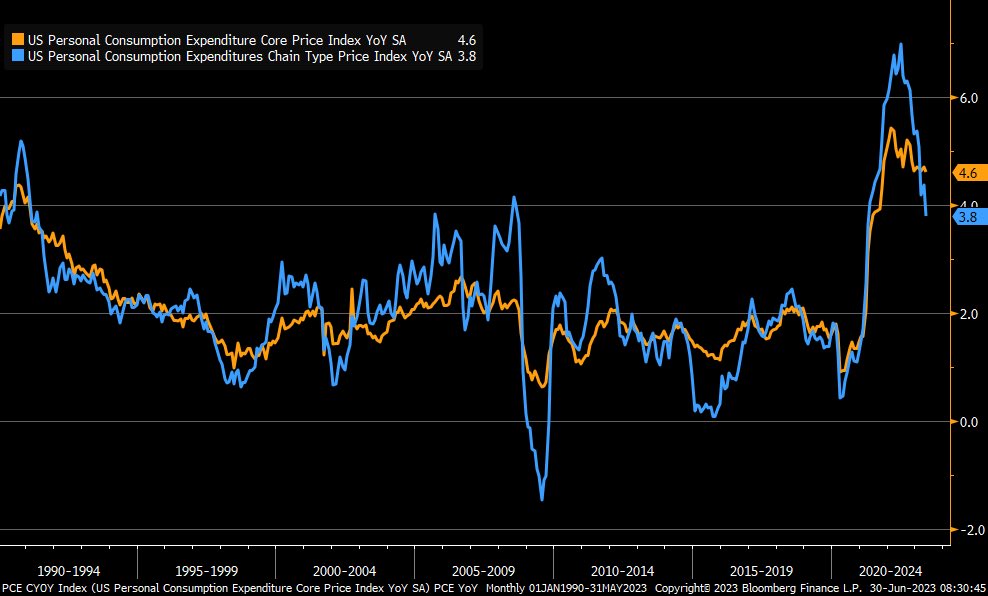
5.4% core CPI in Europe and 4.6% PCE U.S. are just the numbers we need to infer that banks could still raise rates, but the speed (for sure) and perhaps the number of times they raise is coming to an end.
The FED wants a weaker jobs market, and we could see that in the near-future.
Plus, a new round of inflation.
Regardless, the market anticipated a bull run for the first 6 months of the year as it is forward thinking.
The market saw the rate of change for interest rate hikes slowing, the economy most likely not contracting further, inflation potentially peaking and the technology sector cheap and appealing.
We can certainly thank the consumers in large part for the great economic stats as they are the reason the market and economy have been stronger. YOLO?
If we had to define current sentiment into two categories, it appears anger (France) and fatalism (YOLO) win.
However, now that GDP rose for 3 quarters consecutively, one must wonder whether the market will continue to project further economic strength for the second 1/2 of the year.
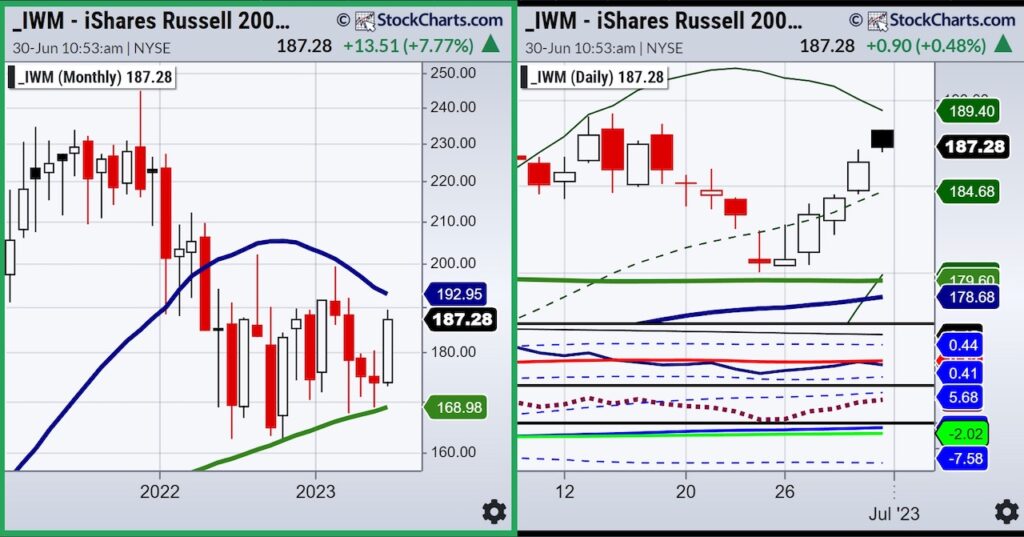
In the case of small caps, a trading range prevails, which means we need to see small caps show new leadership to remain bullish.
We also need to see other consumer areas surface besides the large rallies thus far in airlines and cruise ships.
On the Daily chart, the middle chart or our Leadership Indicator has IWM underperforming the S&P 500 benchmark.
On the monthly chart, IWM has yet to demonstrate any real expansion.
The Real Motion or momentum indicator at the bottom illustrates a bullish divergence. Hence, IWM must get moving in price for a more roseate second ½ of the year setup.
Now, add in the uncertainties around the world such as weather (drought and floods), Russia (is it over?), China (more chip wars) global inflation (still sticky), supply chain (de-globalization), labor (wages rising), and social unrest (France)
And the one-way call for disinflation seems way too one-way.
Flexible and active traders will prevail for the next 6 months.
Other than some volatility in the commodities area along with the recent healthy correction, we still maintain a stagflation environment will persist until 2025.
Looking at the 30-year cycles in commodities versus stocks (going back to 1933), the next 15 years starting this week, are projected to see commodities outperforming by potentially more than 3:1.
We are watching the 20+ year long bonds (TLT) for clues.
So far, the bonds have not moved much. A rally from current levels (over 104) and we will become more defensive in equities. And most likely more friendly to commodities and precious metals

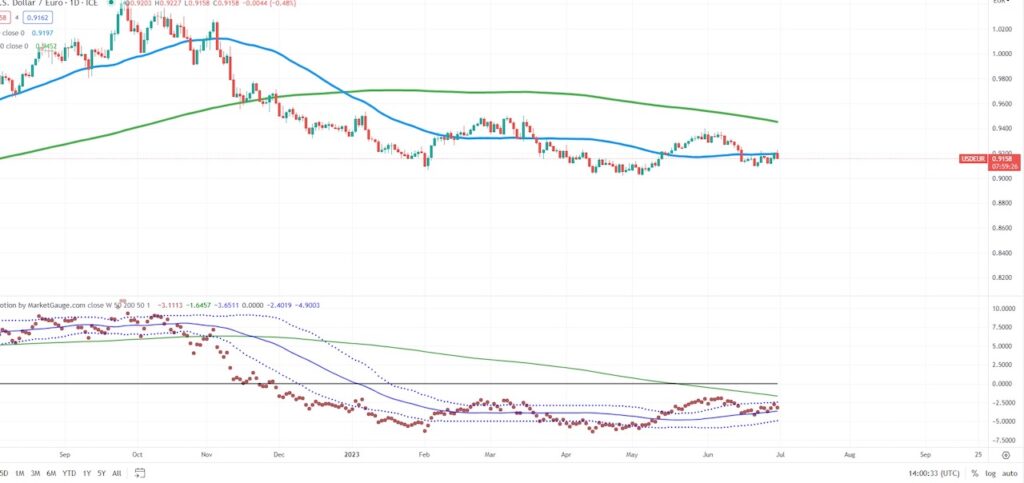
Finally, we have eyes on the U.S. Dollar versus the Euro.
The dollar stopped right at the resistance level of .92. Under .90, we would expect more dollar weakness.
Twitter: @marketminute
The author may have a position in mentioned securities at the time of publication. Any opinions expressed herein are solely those of the author and do not represent the views or opinions of any other person or entity.


