 By Andrew Nyquist
With improving technicals and a lion’s share of the downside priced in, the financials are showing relative strength. And, although it is early in the new year, they are leading the market higher. No doubt, it is much too early to foresee the rest of 2012, but if this story has legs, it will provide support for the coming market pullback, as well as offer investment opportunity.
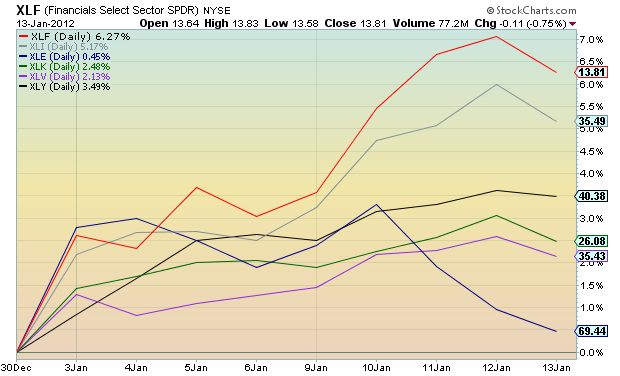
The chart below provides a percent-gain breakdown by sector for the first two weeks of the new year. And although it doesn’t feel right to call the Financials a market leader, they are in fact leading, and have been since mid-December. The Financials Select Sector (XLF) is up over 6% for the year (compared in chart below against Industrials (XLI), Energy (XLE), Technology (XLK), Healthcare (XLV), and Consumer Discretionary (XLY)).
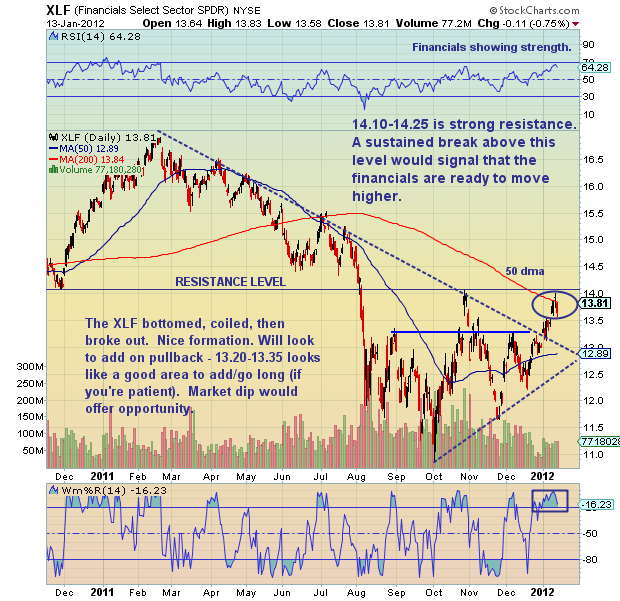
Now be careful not to get carried away with this. There will be a pullback (and soon) and it will need to be played like any other investment (with a stop!). The near term chart with technical analysis overlay (see below) shows that a pullback to 13.20-13.35 would offer opportunity on the XLF (stops set depending on risk profile and type of investor – short- or long-term). And this doesn’t mean that any and all financials can be bought. Far from it. Do your homework and find winners that will do well if Financials continue to lead in 2012. And pay attention to support and resistance levels.
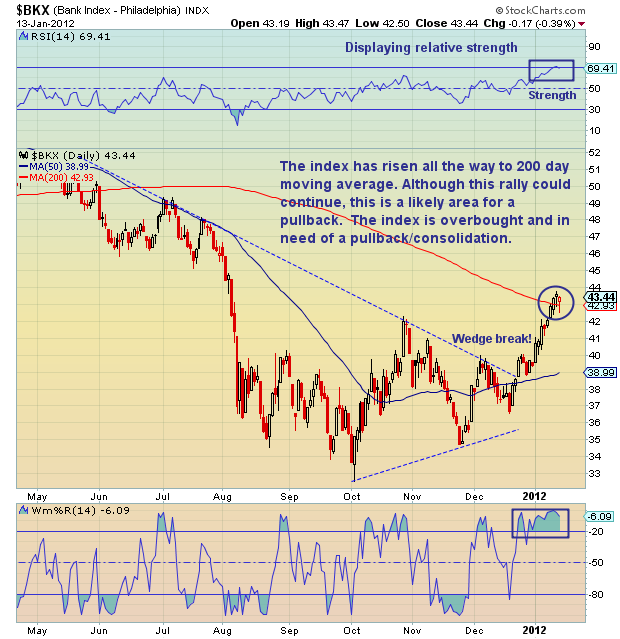
Below is chart for Regional Banks index (BKX). It has been strong as well, but supports the notion for a market pullback as it is overbought and in need of digestion and consolidation.
Editor’s Note (additional color) – 1/17/12: Stocks like Goldman Sachs (GS), Morgan Stanley (MS) have raced higher but are still caught in short term wedge formations. Citigroup (C) and Bank of America (BAC) have raced through near term resistance and into more important longer-term downtrend resistance. And Stocks such as PNC Financial (PNC) have broken higher and shown relative strength. Note that PNC’s 50 day moving average is about to break higher through its 200 day moving average, a bullish longer term signal.
———————————————————
Your comments and emails are welcome. Readers can contact me directly at andrew@seeitmarket.com or follow me on Twitter on @andrewnyquist or @seeitmarket. For current news and updates, be sure to “Like” See It Market on Facebook. Thank you.
No positions in any of the securities mentioned at time of publication.
Any opinions expressed herein are solely those of the author, and do not in any way represent the views or opinions of his employer or any other person or entity.


