 Last week reminded investors just how quickly volatility can make a come back. And just how uncomfortable it can be. After a big down day Tuesday, the markets recovered with an even bigger up day on Wednesday. But this was nothing more than a bull trap, as the bears pounded the market lower Thursday and Friday. And, at the time of this writing, the S&P 500 futures are indicating more discomfort for stocks on Monday. So the question remains: is the current stock market pullback nearing capitulation?
By deductive reasoning, we know that the stock market typically takes the stairs up (slow steady rise) and the elevator down (quick swift pullbacks/corrections). And considering that the stock market is heading into week 4 of this decline, we can officially say that a change of character has taken place. The stock market is well past the average two week pullback of 2014, and is now on par with the May-June 2013 correction (in time) and may very well stretch to equal the 8 week pullbacks we saw in 2012, and possibly the correction/crash of 2011. That said, much will depend on how quickly complacency gives way to fear, which typically leads to capitulation selling and a bottom in stocks.
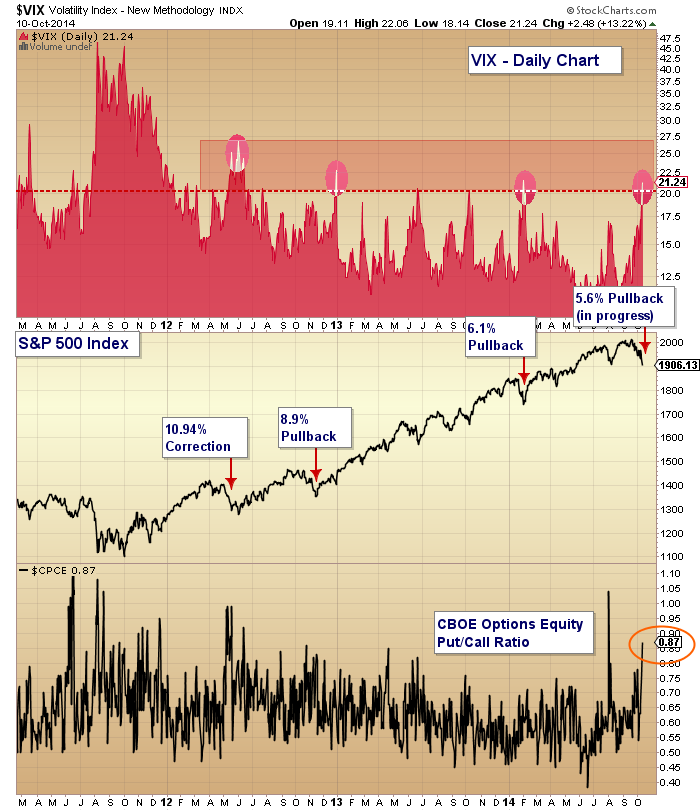
With this in mind, let’s look at two of my favorite indicators of fear in the markets: The Volatility Index (VIX) and the CBOE Options Equity Put/Call Ratio. When the VIX begins to rise, it indicates fear in the markets. And when it spikes, it highlights excessive fear and tends to coincide with capitulation selling in the stock market (usually producing bottoms). As well, when we see the Put/Call ratio ratio rise, it means investors are becoming more defensive (buying puts) and also signals fear in the markets. And when this ratio rises over 1.0, it usually means a bottom is near.
Below is a chart that pulls together the past 4 years of market action, sandwiching the S&P 500 between the VIX (top) and the Put/Call ratio (bottom). Key takeaways:
1) The VIX is above 20 (21.24) for only the fourth time since 2011. Note that the 10.94% correction in 2012 saw the VIX spike to 27. Not too far off. But the larger point here is that fear is present in the market.
2) The Put/Call ratio is currently at 0.87. This is definitely a sign of rising/spiking fear, but I’d like to see the ratio hit 1.00 (or higher) to mark a solid bottom.
And although this could lead to a bottom over the coming week or two, the fact remains that the stock market won’t be ready to move higher until the VIX and Put/Call ratio reverse lower. And this won’t happen until a spike top is “in”, signaling a capitulation in selling.
For more on key S&P 500 technical support levels, check out my post from last week.
Thanks for reading.
Follow Andrew on Twitter: @andrewnyquist
The author holds a trading position in the S&P 500 (SPY) at the time of publication. Any opinions expressed herein are solely those of the author, and do not in any way represent the views or opinions of any other person or entity.


