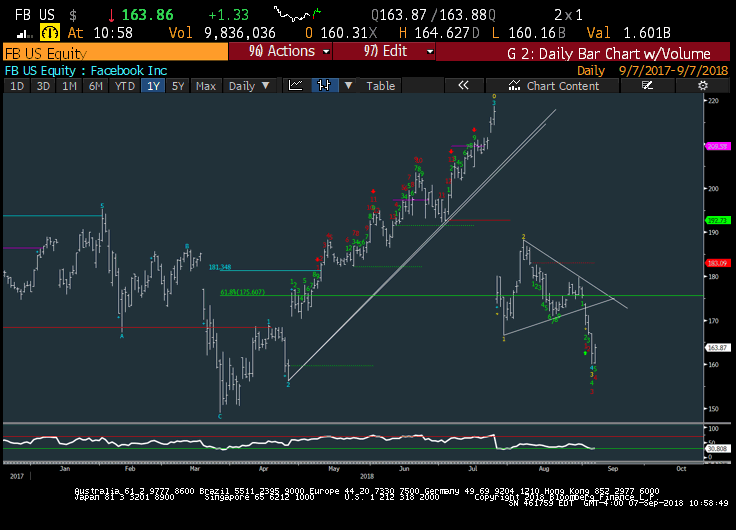
Facebook’s stock slide turned ugly yesterday as it broke down through a well-formed bearish triangle.
Thus far, we have only seen 1 move down in what will likely prove to be a five wave decline for Facebook (FB).
So this move is NOT likely complete.
That said, stocks move in waves, so a strategy / gameplan is important. My current strategy on Facebook stock: Sell rallies into 167-170 for a move down to 149.
Facebook (FB) Daily Chart
The Facebook weekly stock chart (below) is bears some important analysis. Notably, this pullback has reached initial trend line support. 161-162 looks to be quite important.
That said, it likely will be broken on a test of the former lows… will depend on how quickly bulls come to rescue (should that occur).
All together, I expect downside to last into the end of September before a bounce could lead the stock all the way up to 190-200 to form symmetry on the stock chart (with the prior peak) – though the pattern is growing a bit wobbly overall.
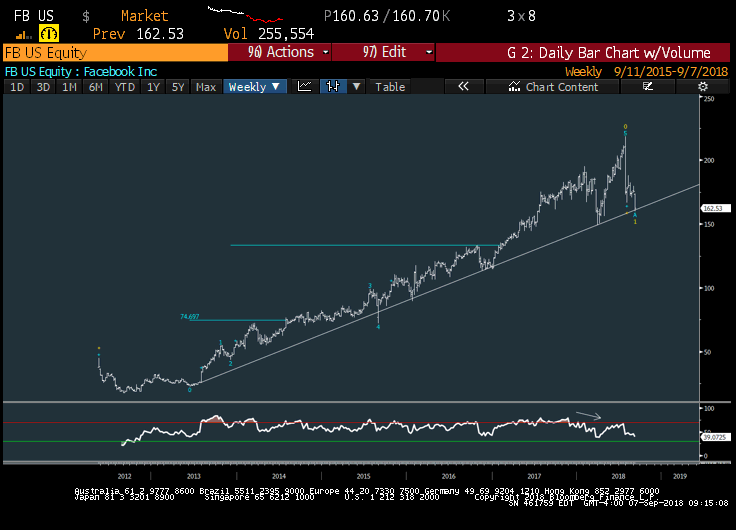
The Bottom line: Facebook stock could be a good buy into the end of September with an upside bounce into Nov/Dec timeframe.
If you have an interest in seeing timely intra-day market updates on my private twitter feed, please follow @NewtonAdvisors. Also, feel free to send me an email at info@newtonadvisor.com regarding how my Technical work can add alpha to your portfolio management process.
Twitter: @MarkNewtonCMT
Author has positions in mentioned securities at the time of publication. Any opinions expressed herein are solely those of the author, and do not in any way represent the views or opinions of any other person or entity.


: Showing Some Signs of Emerging Strength")
