Technology stocks have been a major player in this bull market.
Technology stocks (with the help of small caps) carried the market out of the early 2018 correction. Note that the Nasdaq eclipsed the January highs in March, while the S&P 500 didn’t do so until this month.
Much of this leadership has been shouldered by the FAANG stocks and their super-sized market caps.
So today I want to take a closer look each of the FAANG stock charts (Facebook, Apple, Amazon, Netflix, and Google).
Below are several MarketSmith charts from Investors Business Daily’s product suite.
Note that I use them for charting, data sorts, and comparative analysis. I’m also an IBD partner – you can gain access here: https://ow.ly/Fzzt30lnZZt
Tech Commentary and Thoughts
My short-term outlook for the Nasdaq and Nasdaq 100 is cautious – especially for September. Volatility should rise in September and the major tech indices are showing momentum divergences and have recorded (or will record) sell signals. That said, my longer-term outlook is bullish.
The price trend on both time frames is still “up”… but keep a particular eye on the near-term.
I’ll save this broad-based analysis for another blog post, but I think it’s good to understand the big picture when charting individual stocks.
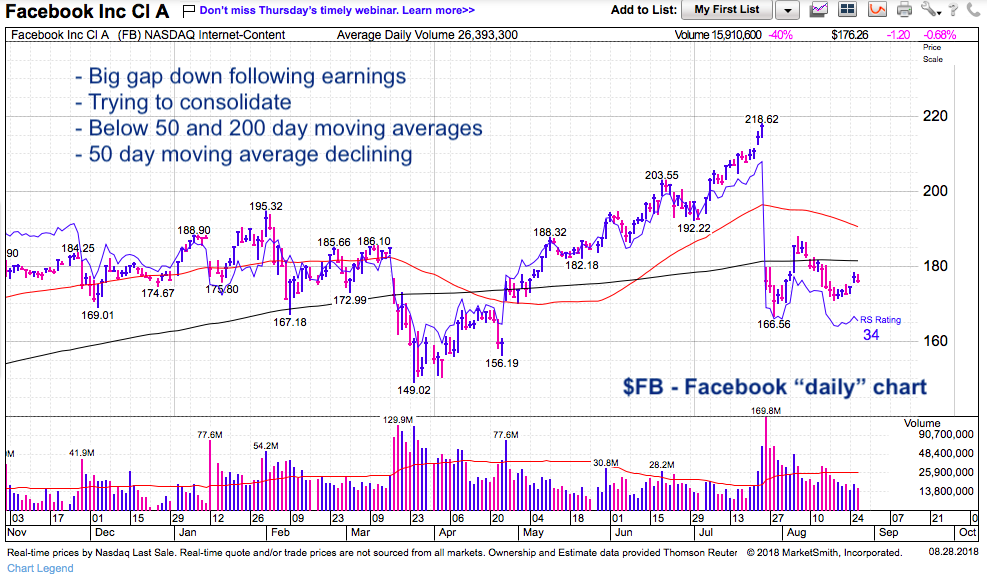
Facebook (FB)
Shares of Facebook have yet to recover from a post-earnings collapse. Sideways movement is attempt at consolidation… but bulls will get tested on next market / Nasdaq pullback. Currently trading below 50 and 200 day moving averages. Note 50 day moving average is falling.
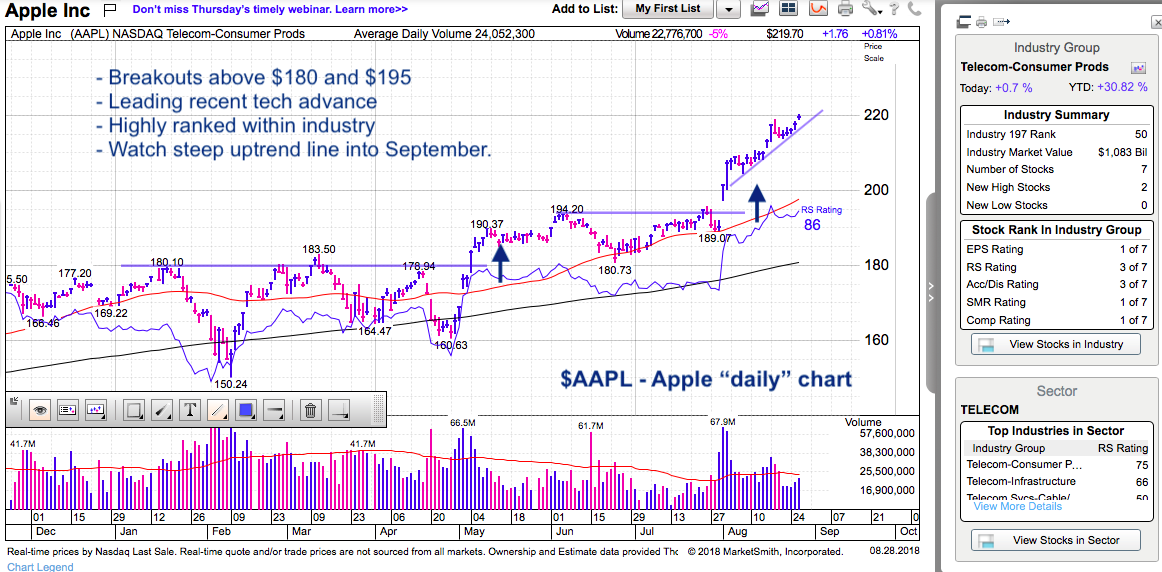
Apple (AAPL)
Apple is a beast. It’s recent breakout propelled the stock over $200… and since then it’s been “running” higher. Note that the short-term uptrend line is fairly steep. Keep an eye on this into month end and early September.
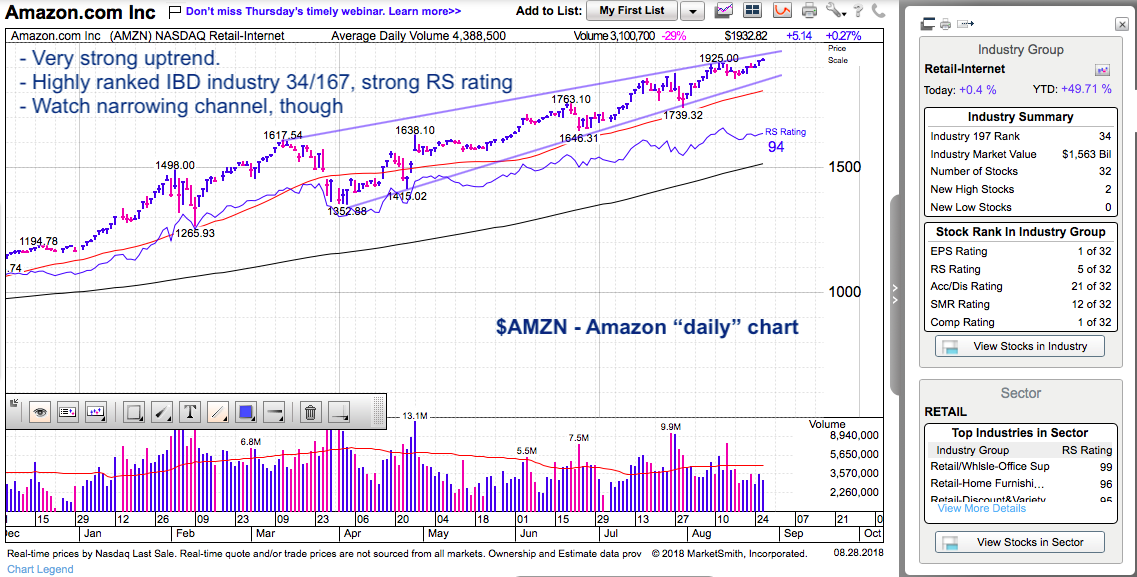
Amazon (AMZN)
Strong chart here for Amazon. The trend continues to be “up” with AMZN trading well above its 50 and 200 day moving averages. Strong support at 50 day moving average and near-term trend line. Note that IBD industry rank is 34/167 (bullish).
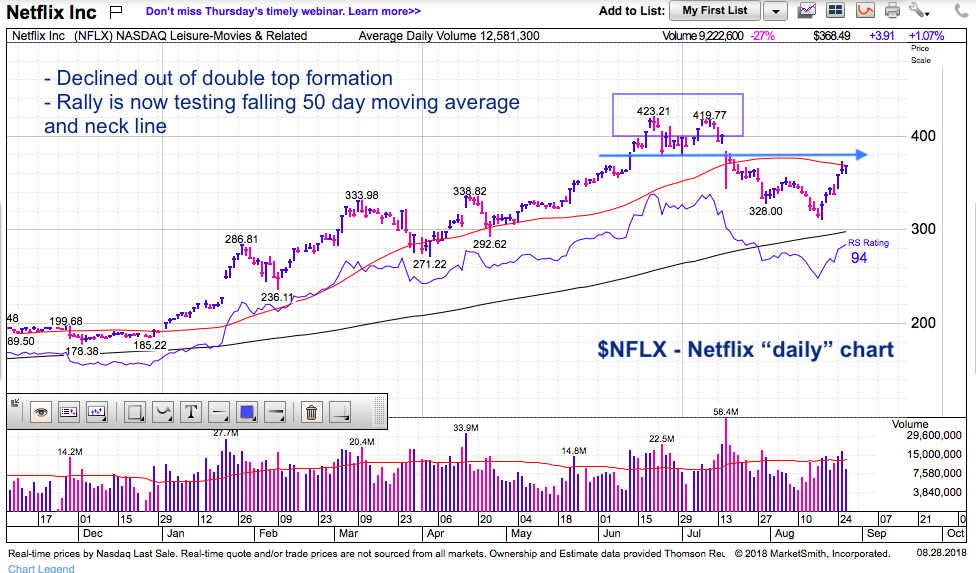
Netflix (NFLX)
RS rating high but well off recent highs. Relative strength vs Nasdaq lagging. A bearish double top formation was violated, triggering a deep decline. Shares have rallied back recently but are testing a “falling” 50 day moving average and neck line from double top.
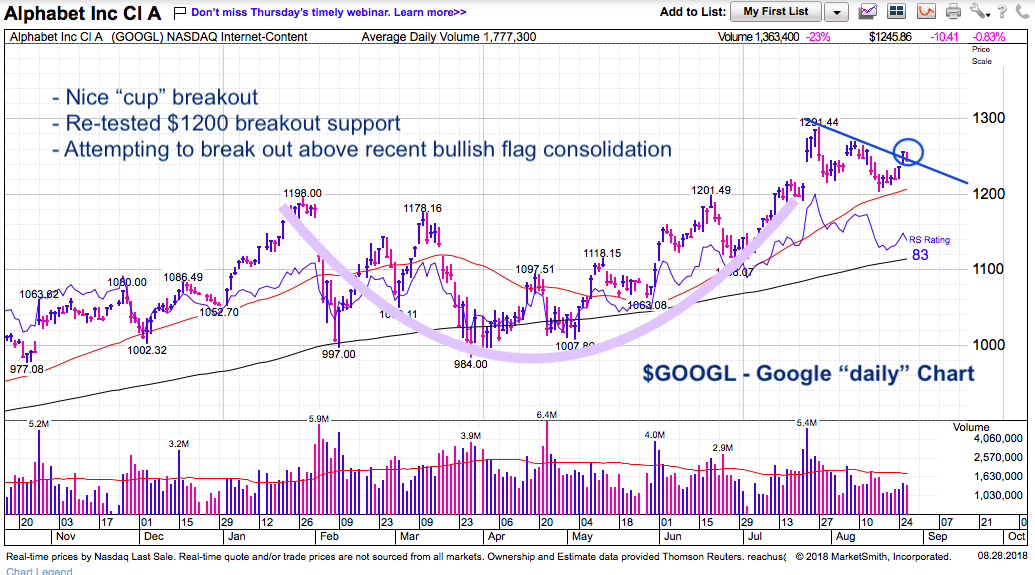
Google (GOOGL)
Strong chart here for Google but $1200 needs to hold. We have a “cup” breakout and successful retest (thus far). Price is trying to breakout of a flag consolidation.
Twitter: @andrewnyquist
The author does not have a position in mentioned securities at the time of publication. Any opinions expressed herein are solely those of the author, and do not in any way represent the views or opinions of any other person or entity.


 Ready To Break Out?")

 Ready To Break Out?")
 Rolling Over At Key Fibonacci Level?")
