Stocks are trading deep in the red this week as challenging stimulus and coronavirus headlines disappoint a market that is ripe for disappointment.
These headlines and election-related jitters could serve a useful purpose IF they allow for a meaningful unwind in investor optimism while not inflicting significant broad market damage.
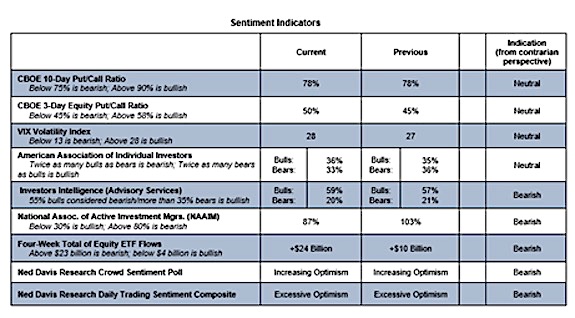
From a weight of the evidence perspective, investor sentiment is the most significant near-term hurdle for stocks (though stocks being priced for perfection does not help either). Relieving excessive optimism is likely necessary before equities can capitalize on improved rally participation and the latest round of breadth thrusts.
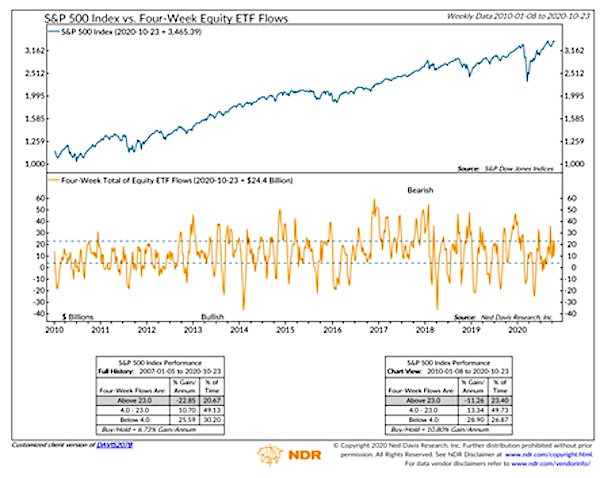
Investor Sentiment: AAII bulls now outnumber bears for the first time since February. Consensus Bulls (not included in the table below) have risen from 58% to 68% over the past three weeks – they are at the highest level since February and just a few percentage points off the January high. Equity ETF flows are matching the optimism seen in sentiment surveys. Over the past 4 weeks, over $24 billion has flowed into equity funds. All of the net gains for the S&P 500 over the past decade have come when this has been below $23 billion.
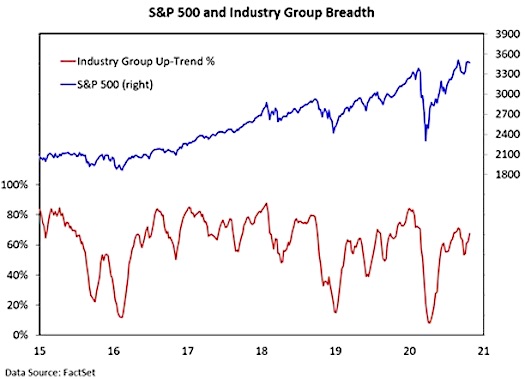
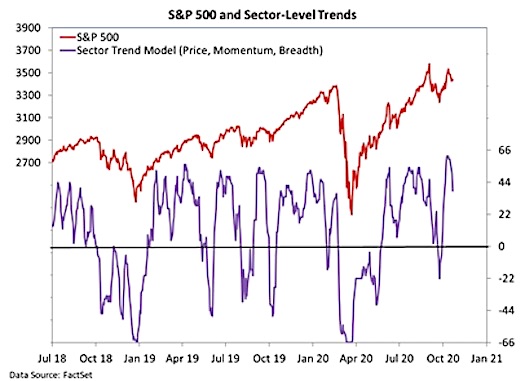
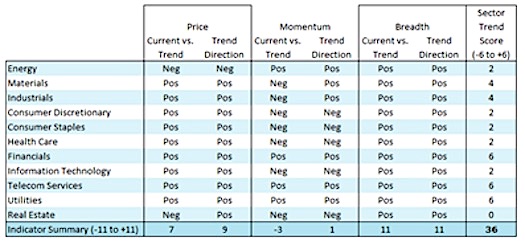
Excessive optimism is working against strong breadth readings, leading to some churning at the index level. Beneath the surface there has been evidence of improvement. The weekly industry group trend indicator (68%) is moving back toward its late-August peak (71%). A failure to clear that level would keep intact a pattern of lower highs that seems inconsistent with broad market strength. Sector-level trends have cooled but remain positive overall (especially from a sector-level breadth perspective).
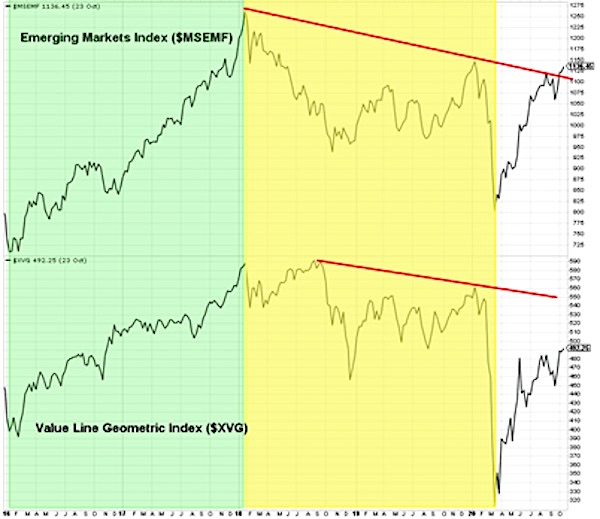
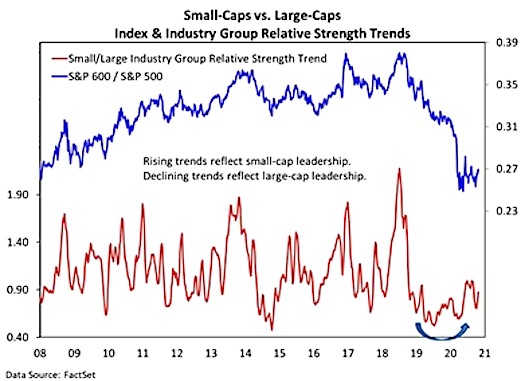
The weekly charts show new recovery highs for both the Value Line Geometric index and the Emerging Market index last week. Equity market leadership that shifts away from US mega-caps and toward domestic mid-caps and small-caps as well as foreign stocks (especially emerging markets) is likely to be a dominant theme in the years ahead. Last week, I highlighted the recent move in copper and the positive implications that could have for Emerging Markets. Earlier this month, I shared a chart showing a turn higher in the ratio between small-cap and large-cap industry group trends. It’s still worth keeping an eye, and is updated below.
Bottom line: Elevated optimism could keep indexes churning ahead of election day. The leadership shift away from US mega-caps is underway and in its early stages.
Twitter: @WillieDelwiche
Any opinions expressed herein are solely those of the author, and do not in any way represent the views or opinions of any other person or entity.


 Flirting With Critical Support… Again")


